bpftrace Variables Monitoring
What Is bpftrace?
bpftrace is a powerful tool for tracing and diagnosing performance issues in Linux systems. It provides a way to script and execute performance monitoring tasks through high-level and human-readable programs. bpftrace is leveraging the extended Berkeley Packet Filter (eBPF) infrastructure in the Linux kernel to safely and efficiently observe a variety of kernel events and user-level probe points.
Monitoring bpftrace With Netdata
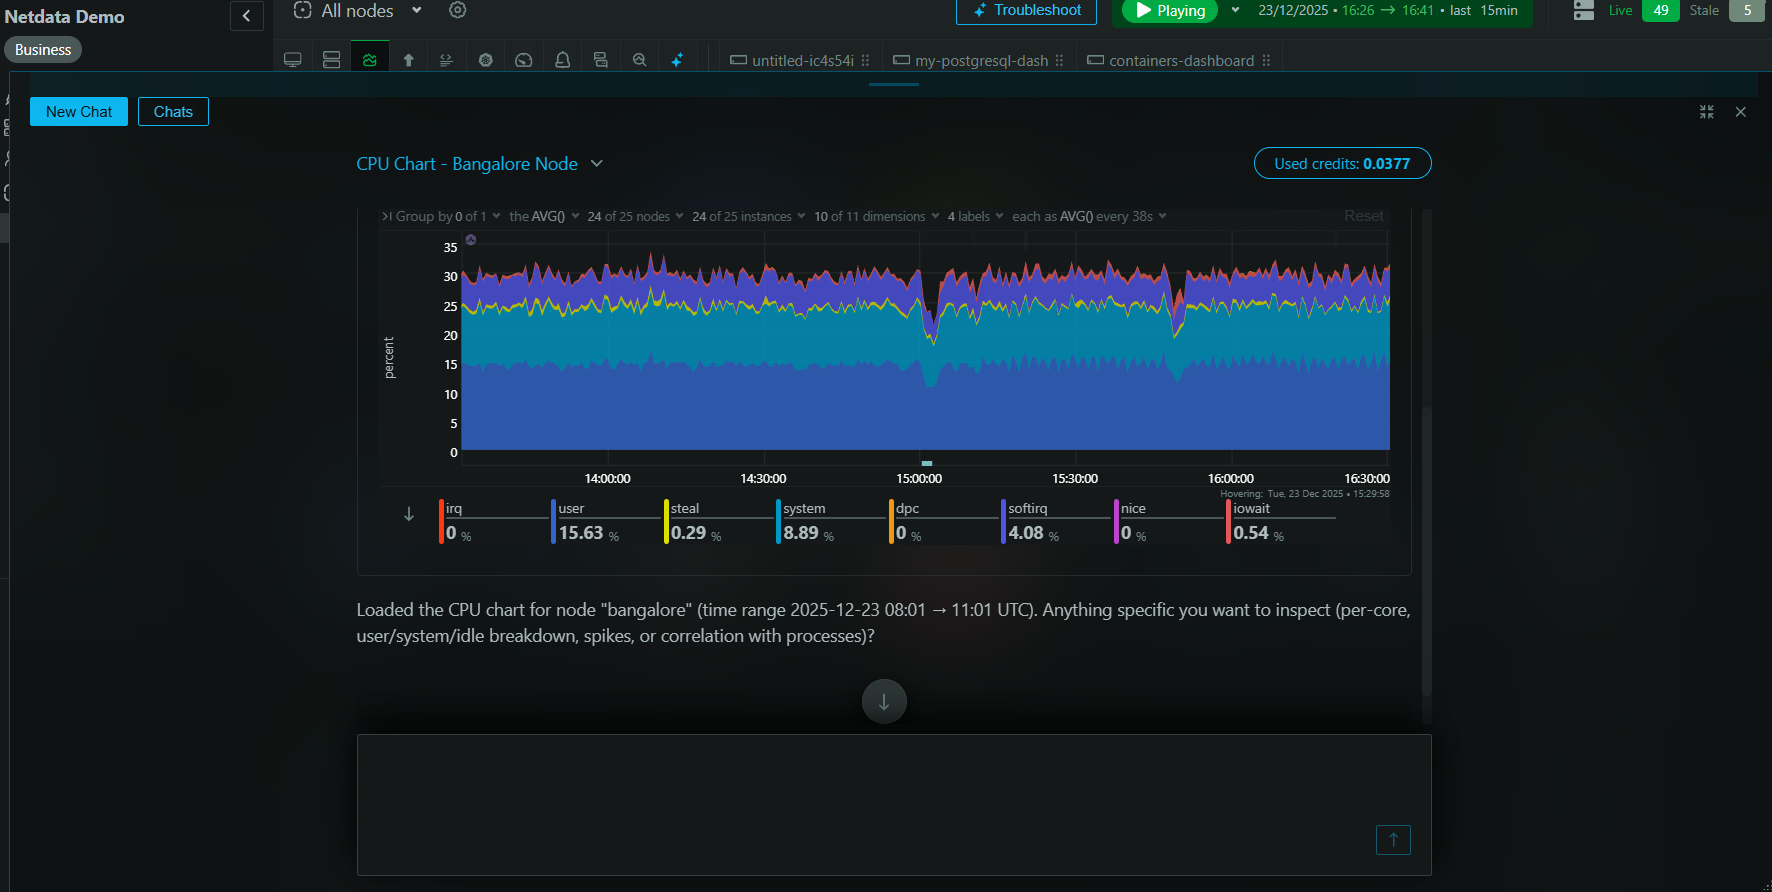
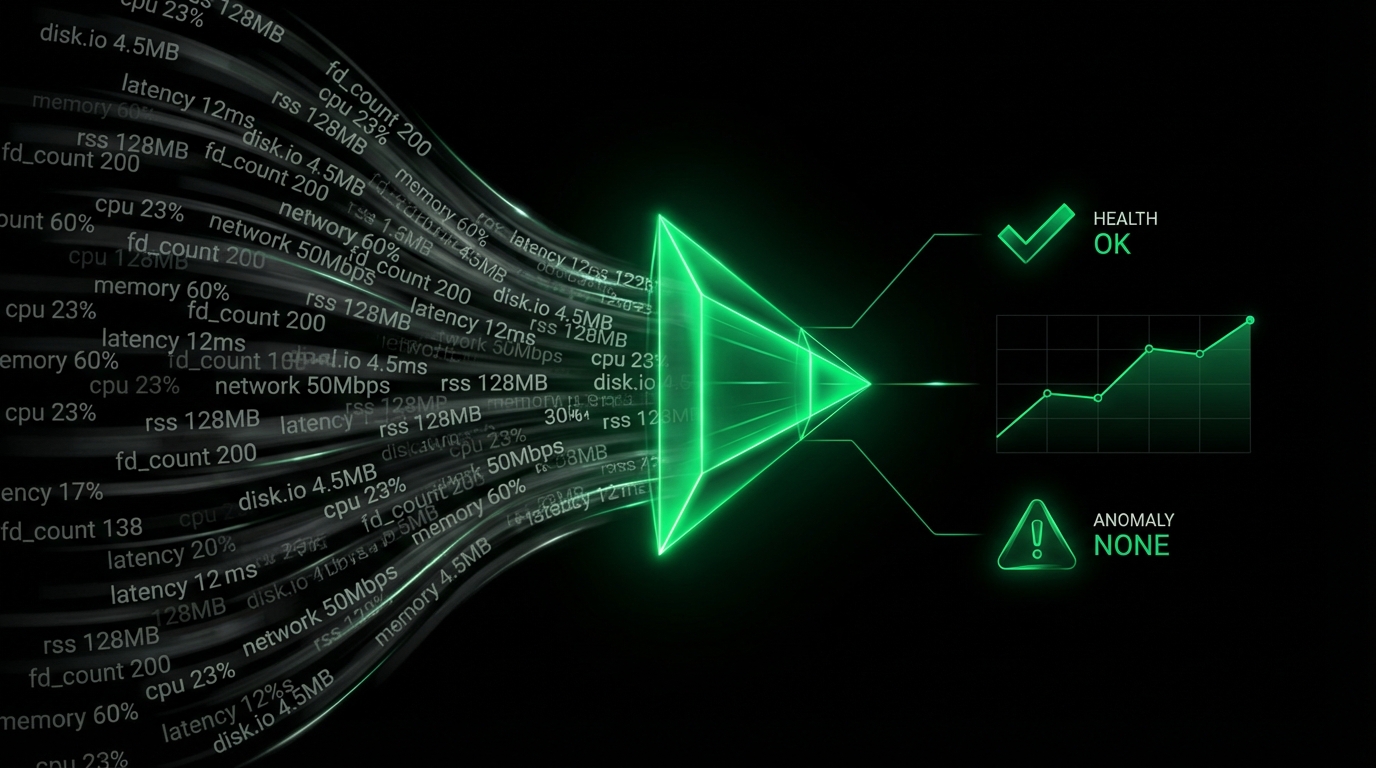
To monitor bpftrace variables, Netdata uses an openmetrics exporter. The bpftrace exporter enables the collection of important performance metrics, allowing you to gain deeper insights without the overhead of setting up your Prometheus server or Grafana dashboards. Netdata seamlessly ingests data from any Prometheus exporter, automating the visualization of metrics and alerts via intuitive dashboards.
Why Is bpftrace Monitoring Important?
Monitoring bpftrace is crucial for maintaining system performance and stability. It enables detailed insights into both system-level and application-specific metrics, which helps in identifying performance bottlenecks and understanding the impact of various system operations on resource utilization. This is especially critical for environments where maximizing uptime and performance is a priority.
What Are The Benefits Of Using bpftrace Monitoring Tools?
Using bpftrace monitoring tools like Netdata, you can access real-time data visualizations and automated alerts that provide instant insights into your system’s performance. This empowers DevOps, SREs, and IT administrators to quickly detect and resolve issues, optimize system resources, and ensure that critical applications run smoothly. Take the opportunity to View Netdata Live or Sign Up To Netdata today.
FAQs
What Is bpftrace Monitoring?
bpftrace monitoring involves observing and analyzing the wide range of metrics output by bpftrace programs to diagnose and troubleshoot performance issues in Linux systems.
Why Is bpftrace Monitoring Important?
It is important for identifying performance bottlenecks, understanding system behavior, and optimizing resource usage to ensure efficient operations.
What Does a bpftrace Monitor Do?
A bpftrace monitor tracks key performance metrics, visualizing them in real-time to help in diagnosing issues and improving system performance.
How Can I Monitor bpftrace In Real Time?
You can monitor bpftrace in real-time using Netdata, which provides automated dashboards and alerts, all without the need for setting up a separate Prometheus server or Grafana instance.


