The only agent that thinks for itself
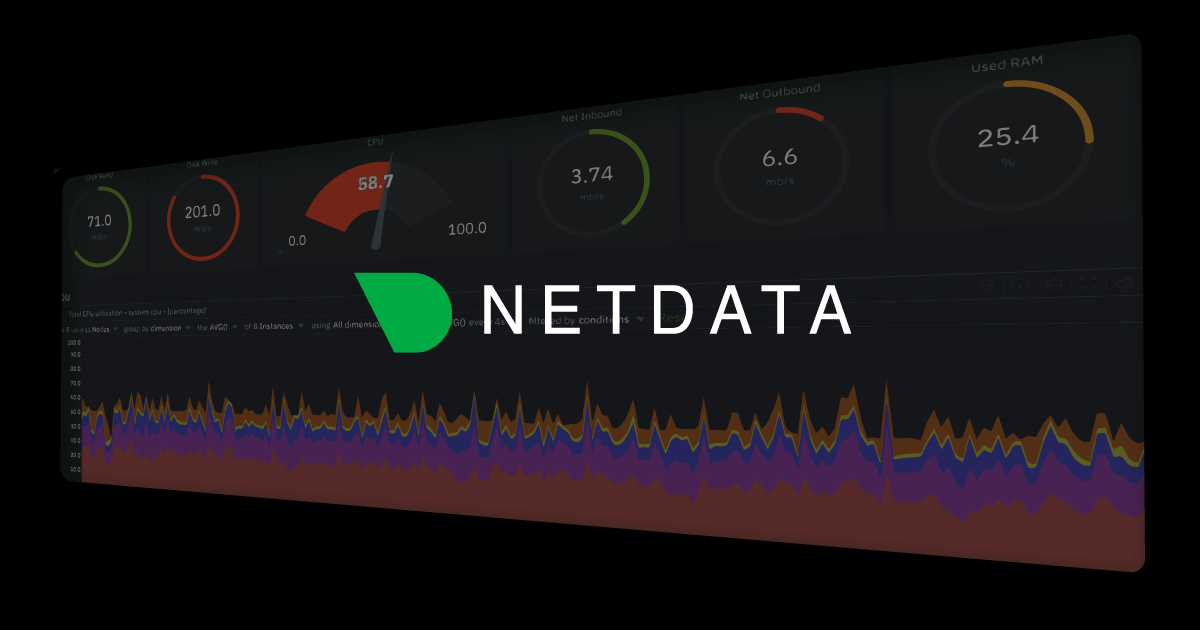
Autonomous Monitoring with self-learning AI built-in, operating independently across your entire stack.
Centralized metrics streaming and storage
Aggregate metrics from multiple agents into centralized Parent nodes for unified monitoring across your infrastructure.
Fully managed cloud platform
Access your monitoring data from anywhere with our SaaS platform. No infrastructure to manage, automatic updates, and global availability.
Deploy Netdata Cloud in your infrastructure
Run the full Netdata Cloud platform on-premises for complete data sovereignty and compliance with your security policies.
Powerful, intuitive monitoring interface
Modern, responsive UI built for real-time troubleshooting with customizable dashboards and advanced visualization capabilities.
Monitor on the go
Native iOS and Android apps bring full monitoring capabilities to your mobile device with real-time alerts and notifications.
The future of infrastructure observability
See our strategic direction across AI-native observability, full-stack signals, operational intelligence, and enterprise platform maturity.
Best energy efficiency
True real-time per-second
100% automated zero config
Centralized observability
Multi-year retention
High availability built-in
Zero maintenance
Always up-to-date
Enterprise security
Complete data control
Air-gap ready
Compliance certified
Millisecond responsiveness
Infinite zoom & pan
Works on any device
Native performance
Instant alerts
Monitor anywhere
AI-native observability
Continuous delivery
Open source foundation

80% Faster Incident Resolution
True Real-Time and Simple, even at Scale
90% Cost Reduction, Full Fidelity
See and Map Your Entire Network
Single Pane of Glass
Control Without Surrender
Integrations
800+ collectors and notification channels, auto-discovered and ready out of the box.
Connect any MCP-compatible AI to your observability data. Automate workflows, playbooks, and incident response.
AWS, GCP, Azure—unified observability across all providers.
On-prem and cloud infrastructure in a single view.
Your metrics stay on your infrastructure. Always.
Reduced monitoring costs by 46% while cutting staff overhead by 67%.
— Leonardo Antunez, Codyas
No data shipping. No central storage costs. Query at the edge.
Real-time connection and device maps, built in the agent — no scheduled discovery scans.
SNMP, flows, traps, and topology unified with your full-stack observability.
So many out-of-the-box features! I mostly don't have to develop anything.
— Simon Beginn, LANCOM Systems
Point-and-click troubleshooting. No PromQL, no LogQL, no learning curve.
Enterprise efficiency without enterprise complexity—real ROI from day one.
Zero data egress. Only metadata reaches the cloud. Your metrics stay on your infrastructure.
Auto-discovered and configured. No manual setup required.
Slack, PagerDuty, Teams, email, webhooks—all built-in.
Built for the People Who Get Paged
Every Industry Has Rules. We Master Them.
Monitor Any Technology. Configure Nothing.
Complete Visibility. Total Control.
Don't Take Our Word for It
Government
Falkland Islands Government
99% less downtime, 30% cloud cost reduction
Transportation
TMB Barcelona
"A rare unicorn that obeys the Pareto rule"
Gaming
Nodecraft
Troubleshooting in 30 seconds, not 3 minutes
Technology
Codyas
46% cost reduction, 67% less monitoring staff
Netdata gives more than you invest in it. A rare unicorn that obeys the Pareto rule.
— Eduard Porquet Mateu, TMB Barcelona
Reduced website downtime by 99% and cloud bill by 30% using Netdata alerts.
— Falkland Islands Government
Optimized resource allocation based on Netdata alerts cut cloud spending by 30%.
Reduced monitoring staff by 67% while cutting operational costs by 46%.
— Codyas
Netdata has agent capacity or a plugin for everything, including Windows and Kubernetes.
From 2-3 minutes to 30 seconds—instant visibility into any node issue.
— Matthew Artist, Nodecraft
20% less downtime and 40% budget optimization from out-of-the-box monitoring.
Pay per Node. Unlimited Everything Else.
One price per node. Unlimited metrics, logs, users, and retention. No per-GB surprises.
What's Your Monitoring Really Costing You?
Most teams overpay by 40-60%. Let's find out why.
Your Infrastructure Is Unique. Let's Talk.
Because monitoring 10 nodes is different from monitoring 10,000.
Monitoring That Sells Itself
Deploy in minutes. Impress clients in hours. Earn recurring revenue for years.
Per-Second Metrics at Homelab Prices
Same engine, same dashboards, same ML. Just priced for tinkerers.
$1,000 Per Referral. Unlimited Referrals.
Your colleagues get 10% off. You get 10% commission. Everyone wins.
"Netdata's significant positive impact" — LANCOM Systems
Compare vs Datadog, Grafana, Dynatrace
"Cut costs by 46%, staff by 67%" — Codyas
"Reduced cloud bill by 30%" — Falkland Islands Gov
"Better observability with Netdata than combining other tools." — TMB Barcelona
DPA, SLAs, on-prem, volume pricing
One command, 30 seconds, real data—no sandbox needed
Auto-config + per-node pricing = predictable profit
8-episode Netdata tutorial by LearnLinux.tv
3rd most starred monitoring project
Customers report 40-67% cost cuts, 99% downtime reduction
Free tier lets them try before they buy
AI Support Assistant, Available 24/7
Nedi has access to all official documentation, source code, and resources. Ask any question about Netdata—responds in your language.
Engineering Insights & Product Updates
Jul 2026
Native macOS Monitoring: Logs, Sensors, …
We’ve overhauled macOS monitoring in …
Jun 2026
Fleet Observability: Linux Edge Device …
It feels less like managing devices and more …
Real Time Network Monitoring: Topology, …
Interface counters tell you a port is busy. …
5 Best SolarWinds Alternatives for 2026
As organizations modernize their …
Never Fight Fires Alone
Docs, community, and expert help—pick your path to resolution.
60 Seconds to First Dashboard
One command to install. Zero config. 850+ integrations documented.
Level Up Your Monitoring
76,000+ Engineers Strong
Per-Second. 90% Cheaper. Data Stays Home.
See why teams switch from Datadog, Prometheus, Grafana, and more.
Trace issues directly in the source code
Get architecture recommendations
Real-time operational status, incident history, and uptime for all Netdata Cloud services.
Copy, paste, monitoring in 60 seconds
Every collector documented
PostgreSQL, NGINX, K8s, and more
Maturity model and implementation
76k+ stars and growing daily
Engineers helping engineers
Netdata is modern, fast, full-stack observability with per-second metrics, AI-powered troubleshooting, and predictable pricing.
One of the most popular open-source monitoring projects
Enterprise-grade security and compliance
Your metrics stay on your infrastructure
"Most energy-efficient monitoring solution" — ICSOC 2023, peer-reviewed
"Doesn't miss alerts—mission-critical trust for safety software"
Global community improving monitoring for everyone
Trusted by teams worldwide
Free forever, fully open source agent
Work from anywhere, async-friendly culture
Your work helps millions of systems
March 4–5, London, UK
February 13, Bengaluru, India
November 17–19, Las Vegas
Pricing, volume discounts, and enterprise needs
Docs, community, and expert help
Continuous compliance monitoring by Drata. View our live security posture and audit reports.
Database monitoring for MySQL, PostgreSQL, SQL Server, Oracle & MongoDB with per-second query insights, deadlock detection & AI root cause. Try free today!
Practical guides for running, troubleshooting, and monitoring ClickHouse in production.
Practical guides for running, troubleshooting, and monitoring CockroachDB in production.
Practical guides for running, troubleshooting, and monitoring MongoDB in production.
Practical guides for running, troubleshooting, and monitoring MySQL in production.
Practical guides for running, troubleshooting, and monitoring PostgreSQL in production.
Diagnose and recover from Cassandra hint window expiration, hint accumulation, and the silent data divergence that follows extended replica outages.
Diagnose and resolve Cassandra hinted handoff backlog and replay storms before coordinator disk exhaustion and cascading replica failures.
Diagnose why Cassandra nodes appear as DN in nodetool status, understand phi accrual failure detection, and recover from gossip flapping and network partitions.
Detect when Cassandra anti-entropy repair stalls, diagnose why repair fails to complete within gc_grace_seconds, and prevent silent tombstone resurrection.
Diagnose and recover from Cassandra UnavailableException when the coordinator cannot satisfy the requested consistency level due to insufficient live replicas.
Deleted data reappears when tombstones expire before repair reconciles them across replicas. Detect the silent failure and recover safely.
How to read ceph_num_objects_degraded correctly, distinguish it from misplaced objects, and alert on stalled recovery instead of normal healing.
What a degraded Ceph placement group means, when it is normal during recovery, and how to alert on it without flooding tickets.
Diagnose and recover Ceph placement groups stuck in the down state, where no surviving replica can serve reads or writes.
What a Ceph PG in incomplete state means, how to diagnose peering failures with ceph pg query, and the recovery paths from OSD restart to force-create-pg.
Ceph scrub found replica divergence. Diagnose which copy is corrupt before running ceph pg repair, or you may propagate the corruption.
Diagnose and recover when ClickHouse loses its ZooKeeper or ClickHouse Keeper coordination layer, including connection checks, 4lw probes, and replica readonly states.
Detect and remediate ClickHouse data corruption from checksum mismatches, broken parts, and detached parts before replication divergence spreads.
Diagnose and fix ON CLUSTER DDL queries that hang or never finish in ClickHouse. Identify stuck hosts, reconcile schema drift, and restore coordination with ZooKeeper or Keeper.
Diagnose and break the ZooKeeper/Keeper saturation spiral that turns replicated ClickHouse clusters read-only.
Break the feedback loop where ClickHouse inserts outrun background merges, parts pile up, and writes are delayed or rejected.
A production monitoring checklist for ClickHouse organized by maturity level, from survival signals to expert diagnostics.
Diagnose and recover stuck ClickHouse mutations when parts_to_do stops decreasing, including quick checks, root causes, and safe remediation steps.
Diagnose and recover a ClickHouse replica that has silently diverged from its peers using SYSTEM RESTART REPLICA and the supported limits of SYSTEM RESTORE REPLICA.
Diagnose ClickHouse replication lag using system.replicas, system.replication_queue, and background pool signals. Learn to tell a saturated fetch pool from a stuck mutation or a readonly replica.
Diagnose and fix stuck ClickHouse replication queue entries by reading num_tries, last_exception, and entry types instead of relying on delay alone.
Diagnose and recover replicated ClickHouse tables stuck in readonly mode caused by lost Keeper sessions, coordination failures, or quorum loss.
Diagnose and recover when ClickHouse replicas lose ZooKeeper sessions, become read-only, and stop accepting writes.
Operational reference for diagnosing and responding to CockroachDB consistency check failures, checksum mismatches, and confirmed data corruption.
Diagnose and resolve CockroachDB replica unavailable errors, lost Raft quorum, and stuck Raft groups causing range unavailability.
Diagnosing CockroachDB under-replicated ranges, understanding the healing margin, and configuring alerting that separates expected recovery from dangerous fault tolerance loss.
Recover Elasticsearch shards stuck in ALLOCATION_FAILED after exceeding max retries, including reroute API usage and corrupt shard recovery paths.
Distinguish benign yellow cluster states from real allocation blockers. Diagnose unassigned replicas, disk watermarks, and shard allocation failures in Elasticsearch.
Diagnose rising Kafka FailedProduceRequestsPerSec, correlate with ISR and replication health, and stop producer-visible failures before they cascade.
Diagnose elevated Kafka fetch request latency by distinguishing consumer fetches from replica fetches and identifying page cache misses as the root cause.
Diagnose ISR shrink storms, flapping replicas, and the cascade to offline partitions in Kafka production clusters.
Diagnose transient and persistent Kafka LEADER_NOT_AVAILABLE errors by correlating leader elections, controller health, ISR state, and offline partitions.
Troubleshoot Kafka brokers with offline log directories due to disk I/O errors, JBOD failures, and recover partition availability without data loss.
Why acks=all without min.insync.replicas only guarantees leader durability, and how to configure Kafka replication for real fault tolerance without blocking writes.
Diagnose persistent NOT_LEADER_FOR_PARTITION errors by distinguishing transient leader elections from controller event queue backup and broker metadata desync.
Diagnose and fix Kafka NotEnoughReplicasException when acks=all writes fail because the ISR shrank below min.insync.replicas.
Diagnose and recover Kafka partitions with no active leader when OfflinePartitionsCount is nonzero.
Fix and prevent Kafka OffsetOutOfRangeException when consumer lag outruns log retention, causing data loss or forced offset resets.
Diagnose and fix growing Kafka replica fetcher lag before it triggers ISR shrinks and write rejections.
Diagnose and fix Kafka REQUEST_TIMED_OUT errors when acks=all produce requests expire waiting for replication, request queue backup, or slow disk.
What to do when Kafka's UncleanLeaderElectionsPerSec metric rises above zero, confirming silent data loss, and how to recover without deepening the damage.
How to read Kafka's UnderMinIsrPartitionCount metric, distinguish it from under-replication, and confirm producers are actively blocked.
Troubleshoot and clear Kafka under-replicated partitions by identifying lagging followers, correlating disk, network, and GC signals, and applying the right fix without causing further ISR shrink.
Diagnose growing log_send_queue_size and redo_queue_size in Always On Availability Groups, estimate failover RTO, and resolve replication lag.
Diagnose and resolve SQL Server Availability Group replicas stuck in NOT_HEALTHY or DISCONNECTED states, and understand when failover capability is actually compromised.
Diagnose and fix SQL Server error 9002 by reading log_reuse_wait_desc first, then resolving the specific blocker: log backups, open transactions, AG lag, or replication.
Diagnose and break MongoDB connection storm spirals caused by elections, deploys, or network blips. Recognize RSS spikes, ticket contention, and totalCreated churn before they crash the node.
Emergency triage and recovery steps when MongoDB exhausts disk space and the journal cannot write, including WiredTiger space reclamation and recovery procedures.
A leveled checklist of production MongoDB monitoring signals covering liveness, replication, WiredTiger cache, tickets, connections, and disk saturation.
Diagnose and stop MongoDB replica set election storms where primaries repeatedly step down, causing rolling 2-12 second write outages.
Troubleshoot and fix MongoDB NotWritablePrimary errors that occur when applications write to a non-primary node after failover or election.
Fix MongoDB NotPrimaryNoSecondaryOk errors when clients route reads to secondaries without the correct read preference, and prevent stale topology failures after failover.
Diagnose and fix MongoDB oplog window collapse when write surges shrink the replication window and force secondaries into RECOVERING state.
Size and monitor the MongoDB oplog window to prevent secondaries from falling off and forcing full resyncs. Production rules, resize commands, and thresholds.
Understand MongoDB rollback after failover, recover data from the rollback directory, and prevent silent data loss with majority write concern.
Diagnose and recover a MongoDB secondary that has fallen past the primary's oplog window, is stuck in RECOVERING, and requires a full initial sync.
Diagnose and break the MongoDB WiredTiger cache pressure cascade before eviction stalls and latency spikes bring down your replica set.
Diagnose and fix MySQL binary log disk exhaustion caused by missing expiry, lagging replicas, or oversized transactions. Safe manual purge procedures and prevention.
Recover from MySQL errno 28 disk-full conditions by identifying whether binlogs, redo logs, tmpdir, or relay logs consumed the space, and apply the right fix without causing data loss.
Detect true GTID replication divergence versus ordinary lag, identify errant transactions, and decide between empty-transaction injection or a full rebuild.
A tiered operational reference of the core MySQL signals every production instance needs, from survival metrics to expert-level lock diagnostics.
Diagnose why MySQL replication I/O or SQL threads stop, read SHOW REPLICA STATUS errors, and recover safely.
Diagnose and stop a MySQL replication lag death spiral when the replica cannot keep up, relay logs grow, and Seconds_Behind_Source increases monotonically.
Detect when long-running transactions, replication slots, or standby feedback pin the PostgreSQL xmin horizon and block autovacuum from reclaiming dead tuples.
Compare logical and physical PostgreSQL backup approaches, pg_dump versus pg_basebackup, pgBackRest status, and what to use in 2026.
Diagnose why PostgreSQL dead tuple counts grow faster than autovacuum can reclaim them, and fix the root cause before bloat triggers an outage.
Emergency runbook for PostgreSQL disk-full incidents. Diagnose WAL accumulation, replication slots, temp files, and table bloat without guessing.
Monitor datfrozenxid, relfrozenxid, and multixact age with tiered thresholds to catch PostgreSQL transaction ID wraparound while you still have months of runway.
Diagnose and resolve PostgreSQL logical replication failures including subscriber conflicts, schema drift gaps, replica identity misconfiguration, and recovery procedures.
Choose between pg_upgrade and logical replication for PostgreSQL major version upgrades, with rollback strategies and post-upgrade verification.
A staged monitoring checklist that maps the essential PostgreSQL signals, metrics, and thresholds to operational maturity levels, from basic health to predictive operations.
Diagnose unbounded WAL growth in PostgreSQL and recover safely when pg_wal fills the disk, including archive_command failures, replication slot retention, and emergency cleanup.
Detect, diagnose, and fix PostgreSQL streaming replication lag before it turns a routine failover into a data-loss event.
Detect when a stale or orphaned PostgreSQL replication slot retains WAL and fills disk, diagnose the root cause, and recover safely.
Why RabbitMQ messages disappear after a broker restart: the durable queue plus persistent message requirement, transient traps, and the classic queue fsync gap.
How to use rabbitmq-diagnostics check_if_node_is_quorum_critical and the /api/health/checks/node-is-quorum-critical endpoint to gate rolling restarts so you never take a quorum queue below its online majority.
Investigate Redis Cluster PFAIL before it escalates to FAIL. Learn the gossip mechanism, quorum rules, zombie states, and how to distinguish transient pauses from real node failure.
Detect, recover from, and prevent accidental or malicious FLUSHALL and FLUSHDB execution in production Redis deployments.
Why Redis background saves trigger copy-on-write memory spikes that double RSS and OOM-kill containers, and how to diagnose, fix, and prevent them.
Diagnose and fix elevated Redis fork latency caused by Transparent Huge Pages, NUMA misconfiguration, and memory overcommit issues.
Diagnose and fix a Redis replica when master_link_status flips to down, the replication link breaks, and stale reads are served.
Diagnose and fix the Redis READONLY error when applications write to a replica, including routing bugs, stale topology after failover, and runtime misconfigurations.
Diagnose and break replication backlog overflow loops in Redis, where a 1MB default triggers full resync storms that fork the primary and cascade latency to every replica.
Troubleshoot Redis replication lag by measuring byte-level offsets, identifying resource bottlenecks on replicas, and preventing full resync cascades caused by undersized backlogs.
Diagnose why Redis sync_full counters are climbing, identify replication backlog exhaustion, and stop full resync storms before they overwhelm the primary.
What zk_digest_mismatches_count means, the four causes to investigate first, and how to triage single-node corruption from a ZAB replication bug.
Recover from ZooKeeper quorum loss: confirm no leader is elected, identify the cause, and restore enough voting members to form quorum without losing data.
A guide to resolving the common Elasticsearch yellow state by investigating shard allocation- understanding master election- and preventing data divergence
Learn to decode Redis Sentinel logs to identify network partitions and prevent inconsistent cluster states during failover events
Unlock peak database efficiency and reliability with proven strategies for performance tuning and optimization- Say goodbye to bottlenecks and hello to speed.
Enhance Performance, Scalability & Availability Of Databases
Learn everything about monitoring & troubleshooting MongoDB, what metrics are important to monitor and why, and how to monitor MongoDB with Netdata.
Learn everything about monitoring & troubleshooting Patroni, what metrics are important to monitor and why, and how to monitor Patroni with Netdata.
Practical examples of automating room assignment
Enhancing Data Reliability and Accessibility Across Networks
Strategies and Tools for a Smooth Transition to the Cloud
Ensuring Data Availability and Integrity Across Systems
See how Netdata can improve visibility, reduce downtime, and simplify monitoring — no commitment required.