The only agent that thinks for itself
Autonomous Monitoring with self-learning AI built-in, operating independently across your entire stack.
Centralized metrics streaming and storage
Aggregate metrics from multiple agents into centralized Parent nodes for unified monitoring across your infrastructure.
Fully managed cloud platform
Access your monitoring data from anywhere with our SaaS platform. No infrastructure to manage, automatic updates, and global availability.
Deploy Netdata Cloud in your infrastructure
Run the full Netdata Cloud platform on-premises for complete data sovereignty and compliance with your security policies.
Powerful, intuitive monitoring interface
Modern, responsive UI built for real-time troubleshooting with customizable dashboards and advanced visualization capabilities.
Monitor on the go
Native iOS and Android apps bring full monitoring capabilities to your mobile device with real-time alerts and notifications.
The future of infrastructure observability
See our strategic direction across AI-native observability, full-stack signals, operational intelligence, and enterprise platform maturity.
Best energy efficiency
True real-time per-second
100% automated zero config
Centralized observability
Multi-year retention
High availability built-in
Zero maintenance
Always up-to-date
Enterprise security
Complete data control
Air-gap ready
Compliance certified
Millisecond responsiveness
Infinite zoom & pan
Works on any device
Native performance
Instant alerts
Monitor anywhere
AI-native observability
Continuous delivery
Open source foundation

80% Faster Incident Resolution
True Real-Time and Simple, even at Scale
90% Cost Reduction, Full Fidelity
See and Map Your Entire Network
Single Pane of Glass
Control Without Surrender
Integrations
800+ collectors and notification channels, auto-discovered and ready out of the box.
Connect any MCP-compatible AI to your observability data. Automate workflows, playbooks, and incident response.
AWS, GCP, Azure—unified observability across all providers.
On-prem and cloud infrastructure in a single view.
Your metrics stay on your infrastructure. Always.
Reduced monitoring costs by 46% while cutting staff overhead by 67%.
— Leonardo Antunez, Codyas
No data shipping. No central storage costs. Query at the edge.
Real-time connection and device maps, built in the agent — no scheduled discovery scans.
SNMP, flows, traps, and topology unified with your full-stack observability.
So many out-of-the-box features! I mostly don't have to develop anything.
— Simon Beginn, LANCOM Systems
Point-and-click troubleshooting. No PromQL, no LogQL, no learning curve.
Enterprise efficiency without enterprise complexity—real ROI from day one.
Zero data egress. Only metadata reaches the cloud. Your metrics stay on your infrastructure.
Auto-discovered and configured. No manual setup required.
Slack, PagerDuty, Teams, email, webhooks—all built-in.
Built for the People Who Get Paged
Every Industry Has Rules. We Master Them.
Monitor Any Technology. Configure Nothing.
Complete Visibility. Total Control.
Don't Take Our Word for It
Government
Falkland Islands Government
99% less downtime, 30% cloud cost reduction
Transportation
TMB Barcelona
"A rare unicorn that obeys the Pareto rule"
Gaming
Nodecraft
Troubleshooting in 30 seconds, not 3 minutes
Technology
Codyas
46% cost reduction, 67% less monitoring staff
Netdata gives more than you invest in it. A rare unicorn that obeys the Pareto rule.
— Eduard Porquet Mateu, TMB Barcelona
Reduced website downtime by 99% and cloud bill by 30% using Netdata alerts.
— Falkland Islands Government
Optimized resource allocation based on Netdata alerts cut cloud spending by 30%.
Reduced monitoring staff by 67% while cutting operational costs by 46%.
— Codyas
Netdata has agent capacity or a plugin for everything, including Windows and Kubernetes.
From 2-3 minutes to 30 seconds—instant visibility into any node issue.
— Matthew Artist, Nodecraft
20% less downtime and 40% budget optimization from out-of-the-box monitoring.
Pay per Node. Unlimited Everything Else.
One price per node. Unlimited metrics, logs, users, and retention. No per-GB surprises.
What's Your Monitoring Really Costing You?
Most teams overpay by 40-60%. Let's find out why.
Your Infrastructure Is Unique. Let's Talk.
Because monitoring 10 nodes is different from monitoring 10,000.
Monitoring That Sells Itself
Deploy in minutes. Impress clients in hours. Earn recurring revenue for years.
Per-Second Metrics at Homelab Prices
Same engine, same dashboards, same ML. Just priced for tinkerers.
$1,000 Per Referral. Unlimited Referrals.
Your colleagues get 10% off. You get 10% commission. Everyone wins.
"Netdata's significant positive impact" — LANCOM Systems
Compare vs Datadog, Grafana, Dynatrace
"Cut costs by 46%, staff by 67%" — Codyas
"Reduced cloud bill by 30%" — Falkland Islands Gov
"Better observability with Netdata than combining other tools." — TMB Barcelona
DPA, SLAs, on-prem, volume pricing
One command, 30 seconds, real data—no sandbox needed
Auto-config + per-node pricing = predictable profit
8-episode Netdata tutorial by LearnLinux.tv
3rd most starred monitoring project
Customers report 40-67% cost cuts, 99% downtime reduction
Free tier lets them try before they buy
AI Support Assistant, Available 24/7
Nedi has access to all official documentation, source code, and resources. Ask any question about Netdata—responds in your language.
Engineering Insights & Product Updates
Jul 2026
Native macOS Monitoring: Logs, Sensors, …
We’ve overhauled macOS monitoring in …
Jun 2026
Fleet Observability: Linux Edge Device …
It feels less like managing devices and more …
Real Time Network Monitoring: Topology, …
Interface counters tell you a port is busy. …
5 Best SolarWinds Alternatives for 2026
As organizations modernize their …
Never Fight Fires Alone
Docs, community, and expert help—pick your path to resolution.
60 Seconds to First Dashboard
One command to install. Zero config. 850+ integrations documented.
Level Up Your Monitoring
76,000+ Engineers Strong
Per-Second. 90% Cheaper. Data Stays Home.
See why teams switch from Datadog, Prometheus, Grafana, and more.
Trace issues directly in the source code
Get architecture recommendations
Real-time operational status, incident history, and uptime for all Netdata Cloud services.
Copy, paste, monitoring in 60 seconds
Every collector documented
PostgreSQL, NGINX, K8s, and more
Maturity model and implementation
76k+ stars and growing daily
Engineers helping engineers
Netdata is modern, fast, full-stack observability with per-second metrics, AI-powered troubleshooting, and predictable pricing.
One of the most popular open-source monitoring projects
Enterprise-grade security and compliance
Your metrics stay on your infrastructure
"Most energy-efficient monitoring solution" — ICSOC 2023, peer-reviewed
"Doesn't miss alerts—mission-critical trust for safety software"
Global community improving monitoring for everyone
Trusted by teams worldwide
Free forever, fully open source agent
Work from anywhere, async-friendly culture
Your work helps millions of systems
March 4–5, London, UK
February 13, Bengaluru, India
November 17–19, Las Vegas
Pricing, volume discounts, and enterprise needs
Docs, community, and expert help
Continuous compliance monitoring by Drata. View our live security posture and audit reports.
One device-centric, real-time dashboard for your entire network—SNMP metrics, NetFlow analysis, SNMP traps, and live topology unified with per-second granularity and ML anomaly detection.
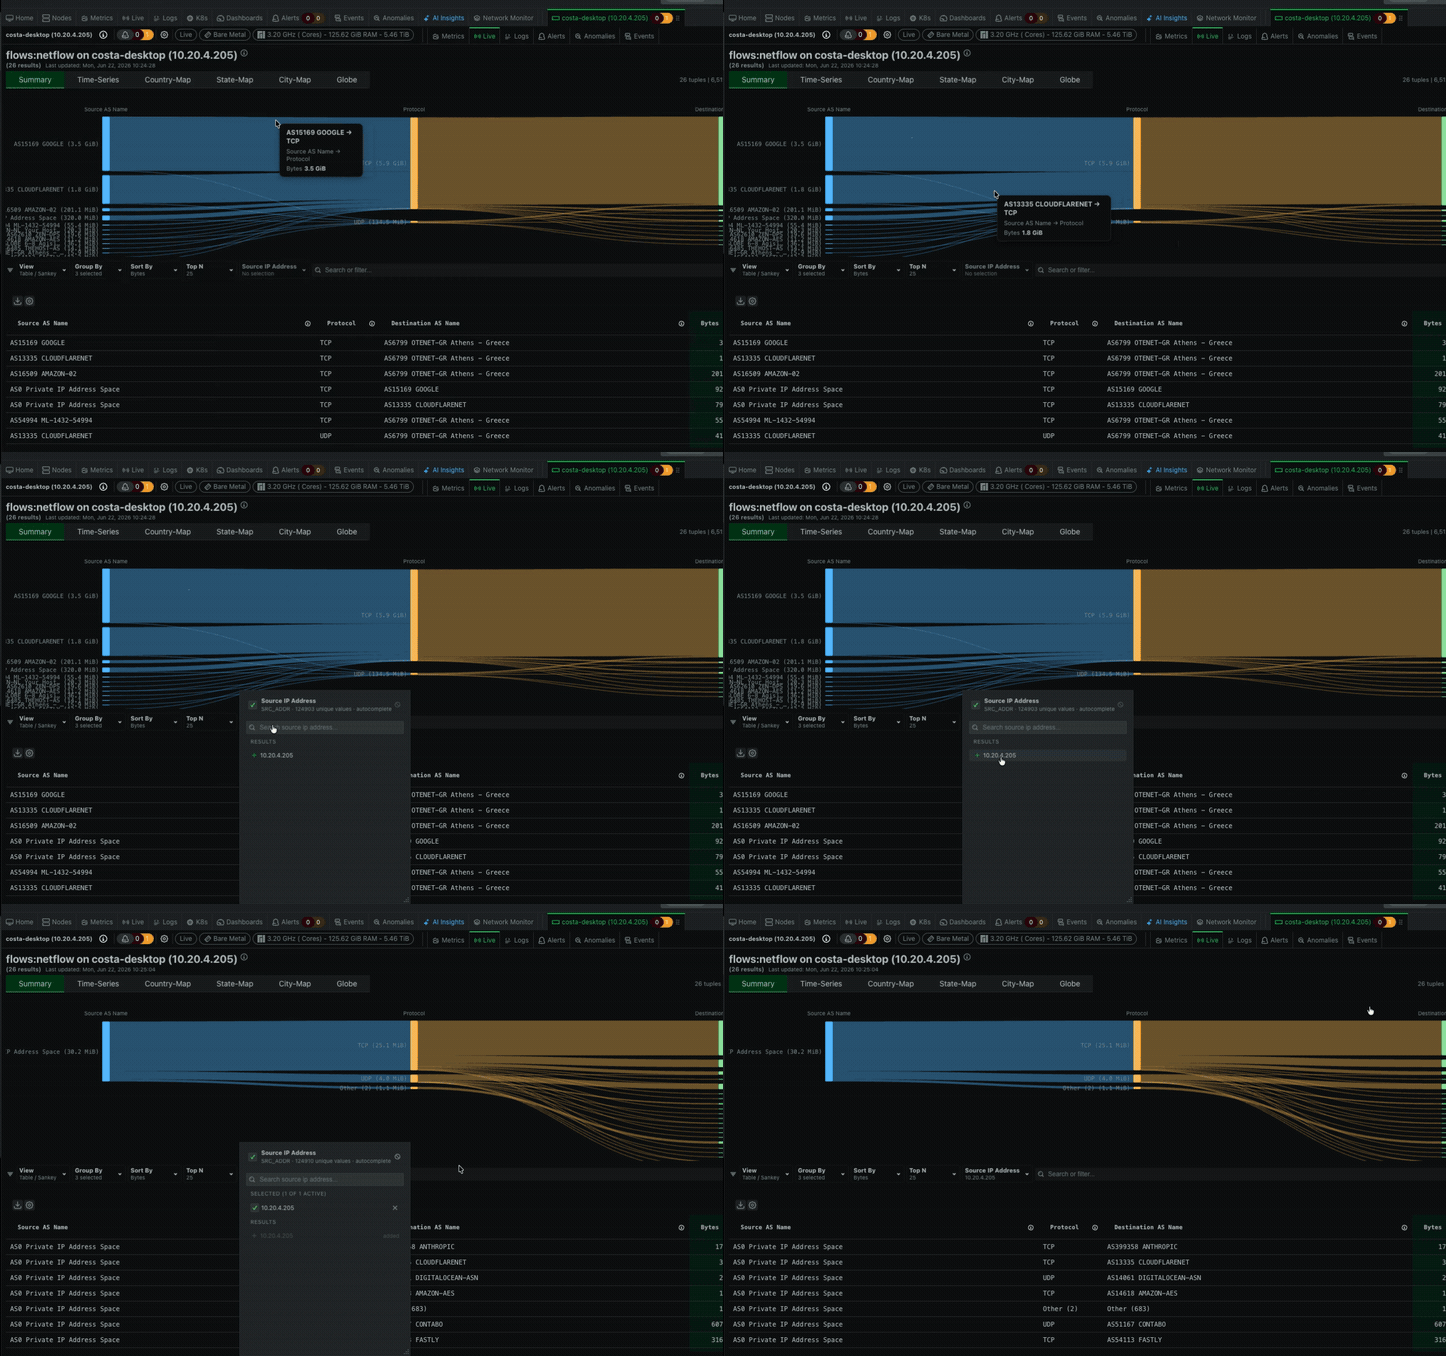
Analyze NetFlow v5/v7/v9, IPFIX, and sFlow v5 traffic in real time with Netdata's edge-native flow analyzer. Top talkers, Sankey diagrams, geographic maps, and rich enrichment — no packet capture required.
Live network topology, NetFlow/sFlow/IPFIX traffic analysis, SNMP device monitoring with 100+ vendor profiles & a native SNMP trap receiver — plus ML anomaly detection that cuts alert noise 99%. Start free.
Real-time network monitoring with per-second visibility, ML-powered anomaly detection & zero-configuration deployment. Start monitoring free today!
Learn how the Decapsulation integration connects with Netdata and how to configure it.
Learn how the IPFIX integration connects with Netdata and how to configure it.
Learn how the NetFlow integration connects with Netdata and how to configure it.
Learn how the sFlow integration connects with Netdata and how to configure it.
Compare Netdata and Auvik for network and infrastructure monitoring. Real-time per-second collection, ML anomaly detection, full-stack observability, and self-hostable architecture vs MSP-focused network management SaaS.
Practical guides for monitoring, troubleshooting, and operating production networks: SNMP, NetFlow/sFlow/IPFIX, BGP, traps, syslog, and topology.
How to join cloud provider flow logs with on-premises NetFlow and IPFIX across timestamp skew, sampling differences, and NAT boundaries.
How NAT boundaries and wireless NAT hide endpoint identity from topology engines, and what signals reveal the gap.
Diagnose and fix NetFlow v9 or IPFIX template cache desync after an exporter reboot or upgrade that causes flows to be decoded wrong or silently dropped.
A domain-by-domain checklist of the signals production network monitoring stacks need, with maturity levels from survival to expert.
Diagnose and fix Receive Side Scaling misconfiguration that funnels all packet processing to one CPU core on flow, syslog, and trap collectors.
Diagnose and fix silent UDP packet drops in NetFlow, IPFIX, and sFlow collectors using kernel counters, socket buffer tuning, and RSS configuration.
Flow aggregation vs packet sampling - choosing the right export protocol for your network
Understanding the protocol that powers flow-based network visibility
Compare the 10 best network monitoring tools for 2027: SNMP polling depth, NetFlow and sFlow support, topology mapping, polling intervals, and pricing models.
Interface counters tell you a port is busy. They don't tell you what's flowing through it or how your network is wired together. See how Netdata combines live network topology maps with NetFlow analysis to show how traffic actually moves through your routers, switches, and firewalls.
Live topology, flow analysis, SNMP devices, and traps, unified with the rest of your stack.
Looking for a SolarWinds NPM alternative? Netdata delivers per-second SNMP monitoring, automatic device discovery across 800+ vendors, ML anomaly detection on every metric, and network topology mapping with predictable per-node pricing.
Migrating from SolarWinds NetFlow Traffic Analyzer (NTA)? Explore Netdata's modern, per-second NetFlow, sFlow, and IPFIX traffic analysis with interactive Sankey diagrams, street-level city maps, and zero configuration.
See how Netdata can improve visibility, reduce downtime, and simplify monitoring — no commitment required.