The honest microservices observability stack in 2026 is three layers:
- Per-second metrics at every pod — agent-level collection that catches OOMs, restarts, and transient saturation that polling misses.
- Request paths across services — OpenTelemetry traces that show which service, and which span, made a request slow or made it fail.
- Log correlation across services — structured logs with consistent trace IDs so an incident can be reconstructed without grepping.
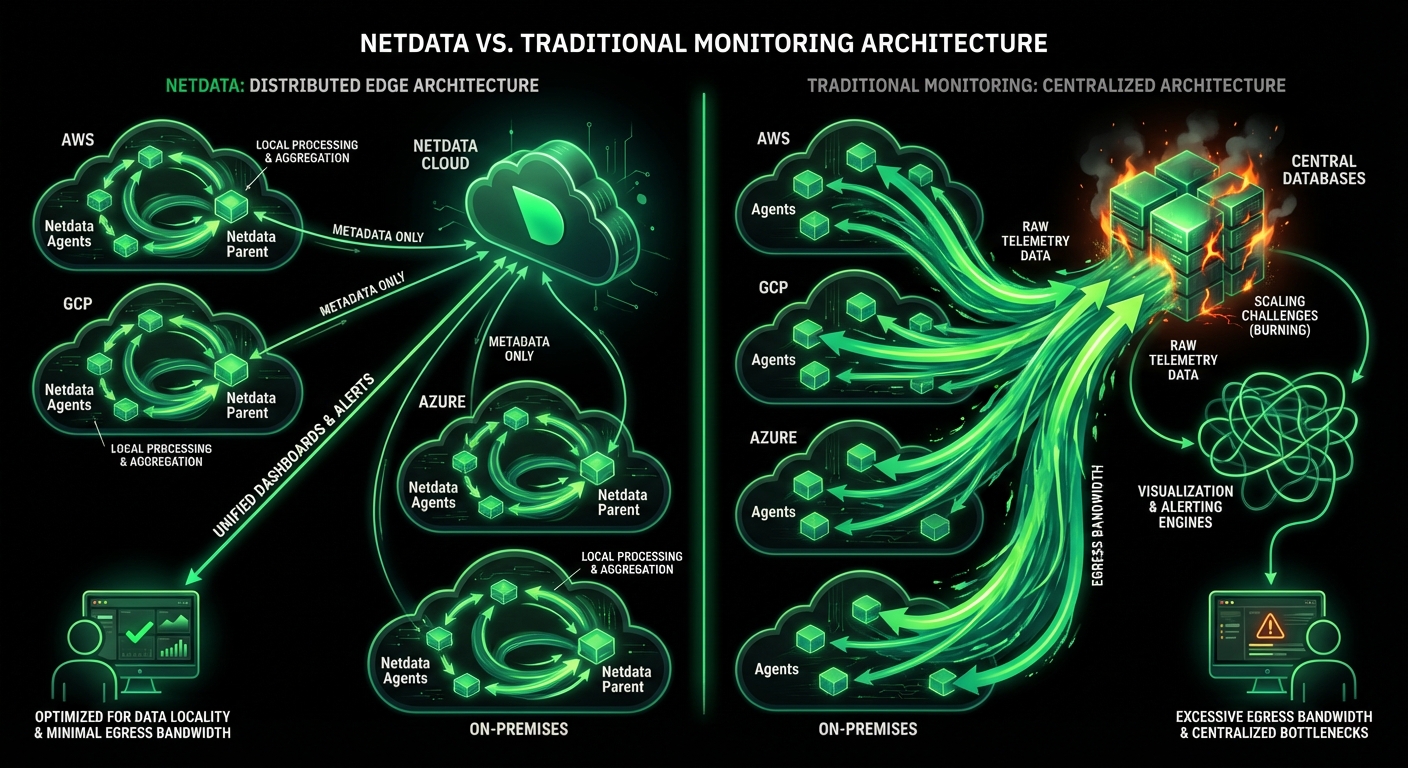
Netdata covers all three on the same agent. Per-pod metrics arrive at one-second resolution, auto-discovered, with ML on every collected metric. Logs are queried where they are written. OpenTelemetry traces arrive over OTLP/gRPC from your SDKs or an OpenTelemetry Collector, and are stored and indexed on your own infrastructure; you explore them in the Traces tab of Netdata Cloud, next to the metrics and logs of the same nodes, with a duration heatmap, a full waterfall for every trace and every span attribute your instrumentation recorded. There is no separate Jaeger or Tempo to deploy for OpenTelemetry-instrumented services.
What Netdata does not do: it does not build service maps or dependency graphs from spans, and it does not do code-level profiling. If your team depends on a generated topology view, keep a tool that provides one. See distributed tracing for microservices for the setup and the trace workflow.














 Microservices Observability