See Every Millisecond That Matters
Netdata captures every metric every second, ingests your OpenTelemetry traces on the same agent, and runs ML-powered anomaly detection that achieves 99% false positive reduction while cutting costs by 90%.

Netdata captures every metric every second, ingests your OpenTelemetry traces on the same agent, and runs ML-powered anomaly detection that achieves 99% false positive reduction while cutting costs by 90%.

The only monitoring platform that combines per-second visibility, edge-native ML, and zero-configuration deployment
Per-second metrics and ML-powered Anomaly Advisor surface root causes in the top 30-50 results, eliminating hours of manual investigation
18-model ML consensus mechanism achieves 99% false positive reduction in anomaly detection while catching real issues other tools miss
Predictable per-node pricing for infrastructure monitoring, with no charges for metrics volume, Logs Monitoring (querying logs in place), users, data retention or containers
Zero-configuration deployment with automatic service discovery and algorithmic dashboards delivers immediate value
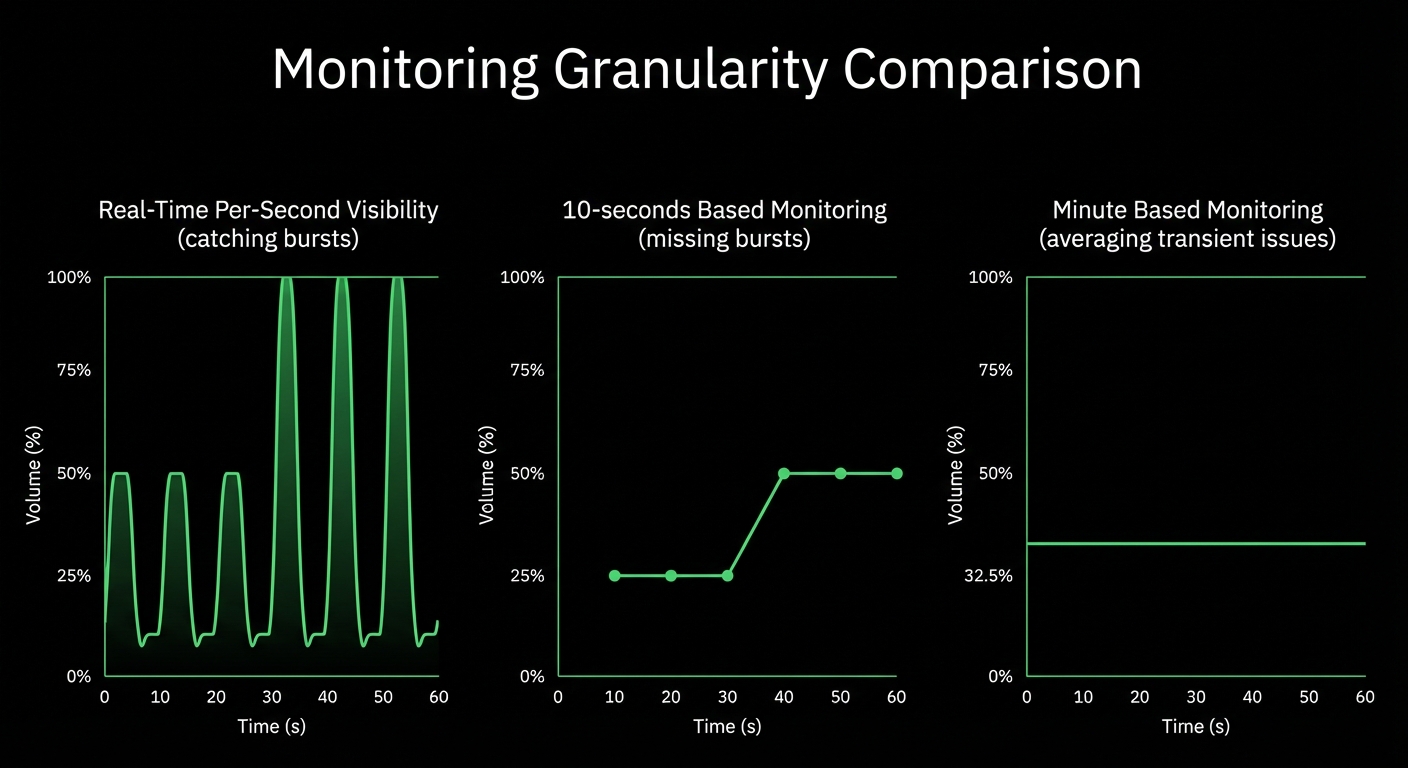
Per-second granularity captures microbursts and transient issues that 30-second monitoring completely misses
Natural language queries and automated root cause analysis accelerate incident response for teams of any skill level
Trusted by DevOps teams worldwide
10-60× more granular than traditional APM
Learn about real-time monitoring

Every accepted span stored and indexed
Explore distributed tracing

18-model ML consensus
Explore ML anomaly detection

80% MTTR reduction
See root cause analysis

60 seconds to value
View quick start guide

90% cost savings vs traditional APM
Compare pricing

Console replacement with history
Explore Netdata Functions

How Netdata Compares
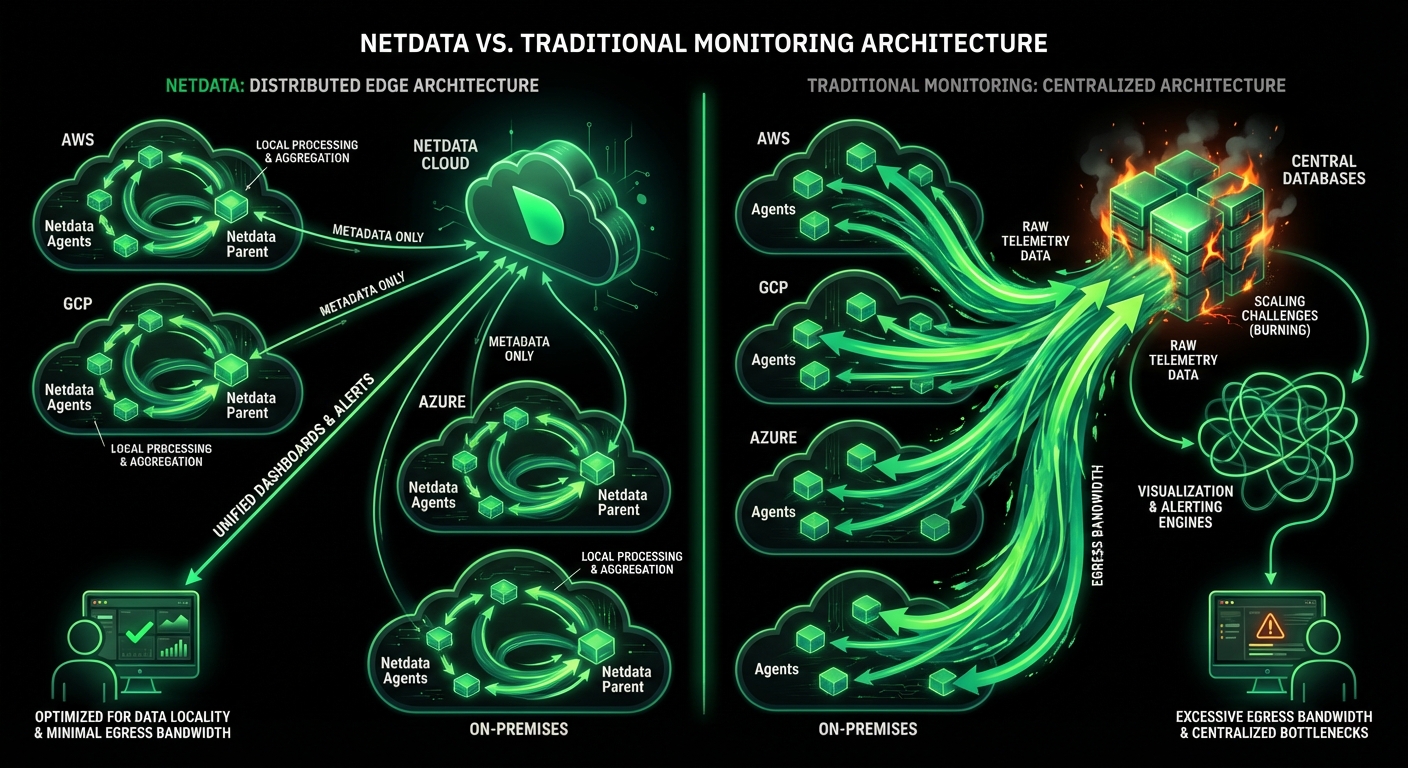
See how Netdata’s edge-native architecture delivers superior performance monitoring at a fraction of traditional APM costs
Capability
Netdata
Traditional APM
Data Granularity
✅ Per-Second
Captures every metric every second
⚠️ 15-60 Seconds
Misses 90% of transient issues
Metric Sample Completeness
✅ Every Sample Kept
Per-second metrics stored at full resolution
⚠️ Often Rolled Up
Metrics aggregated to coarser intervals over time
Distributed Tracing
✅ OpenTelemetry over OTLP
Stored and indexed on your agents; heatmap, waterfall, span details
✅ Advanced
Mature tracing in proprietary or OpenTelemetry formats
Code Profiling
🔹 OpenTelemetry tracing
RED analysis, waterfall and span details on your agents
✅ Advanced
Code profiling in most suites
Anomaly Detection
✅ 18-Model ML
99% false positive reduction
⚠️ Single Model
High false positive rates
Setup Time
✅ 60 Seconds
Zero configuration required
⚠️ Days to Weeks
Extensive manual setup
Query Language
✅ None Required
Point-and-click NIDL framework
⚠️ PromQL/NRQL/SPL
Steep learning curve
Root Cause Analysis
✅ Automated
Top 30-50 results via ML
⚠️ Manual
Hours of investigation
Data Sovereignty
✅ Your Infrastructure
Metrics, logs and traces stay on your nodes
❌ Cloud SaaS
All data centralized
Cost Model
✅ Per-Node Pricing
Per-node pricing, no per-metric charges
❌ Volume-Based
Surprise bills common
Cost Comparison
✅ 90% Lower
Transparent P90 billing
❌ Premium Pricing
Plus volume charges
Agent Overhead
✅ <5% CPU
150-200MB RAM with ML
⚠️ 10-20% CPU
Higher resource usage
High Cardinality
✅ Built for High Cardinality
Edge processing eliminates limits
⚠️ Limited
Backends drop attributes
Kubernetes Support
✅ Native
Per-second container metrics
⚠️ Challenging
40% cite as top issue
Traditional APM centralizes data for analysis, creating bottlenecks and latency. Netdata trains 18 ML models per metric directly on each monitored system, enabling real-time anomaly detection with consensus-based accuracy that achieves 99% false positive reduction.
99% false positive reduction
Learn about ML architecture
Monitor every layer of your application stack with per-second precision
CPU, memory, disk, network with per-second granularity across servers, VMs, and containers
Per-container resource tracking with automatic Kubernetes and Docker discovery
Application logs from any source through OpenTelemetry, every field indexed, plus OS logs queried in place
OpenTelemetry traces with a duration heatmap, full waterfall and span details per request
Real-time visibility into active connections, bandwidth, and connection states
Per-process CPU, memory, I/O with automatic service grouping and classification
Query performance, connection pools, and resource usage for major databases
Request rates, response times, and error tracking for NGINX, Apache, IIS
18-model consensus on every metric achieving 99% false positive reduction
Automated correlation engine surfaces root causes in top 30-50 results

October 5, 2026
Netdata now ingests OpenTelemetry traces over OTLP on the same Agent that collects your metrics and logs. Spans are stored and indexed on your own infrastructure and explored in the new Traces tab in Netdata Cloud.
September 8, 2026
Netdata AI now learns your infrastructure the way a new SRE would: a shared context document your team writes, and a memory layer built from conversations that gets more accurate every time you use it.

June 23, 2026
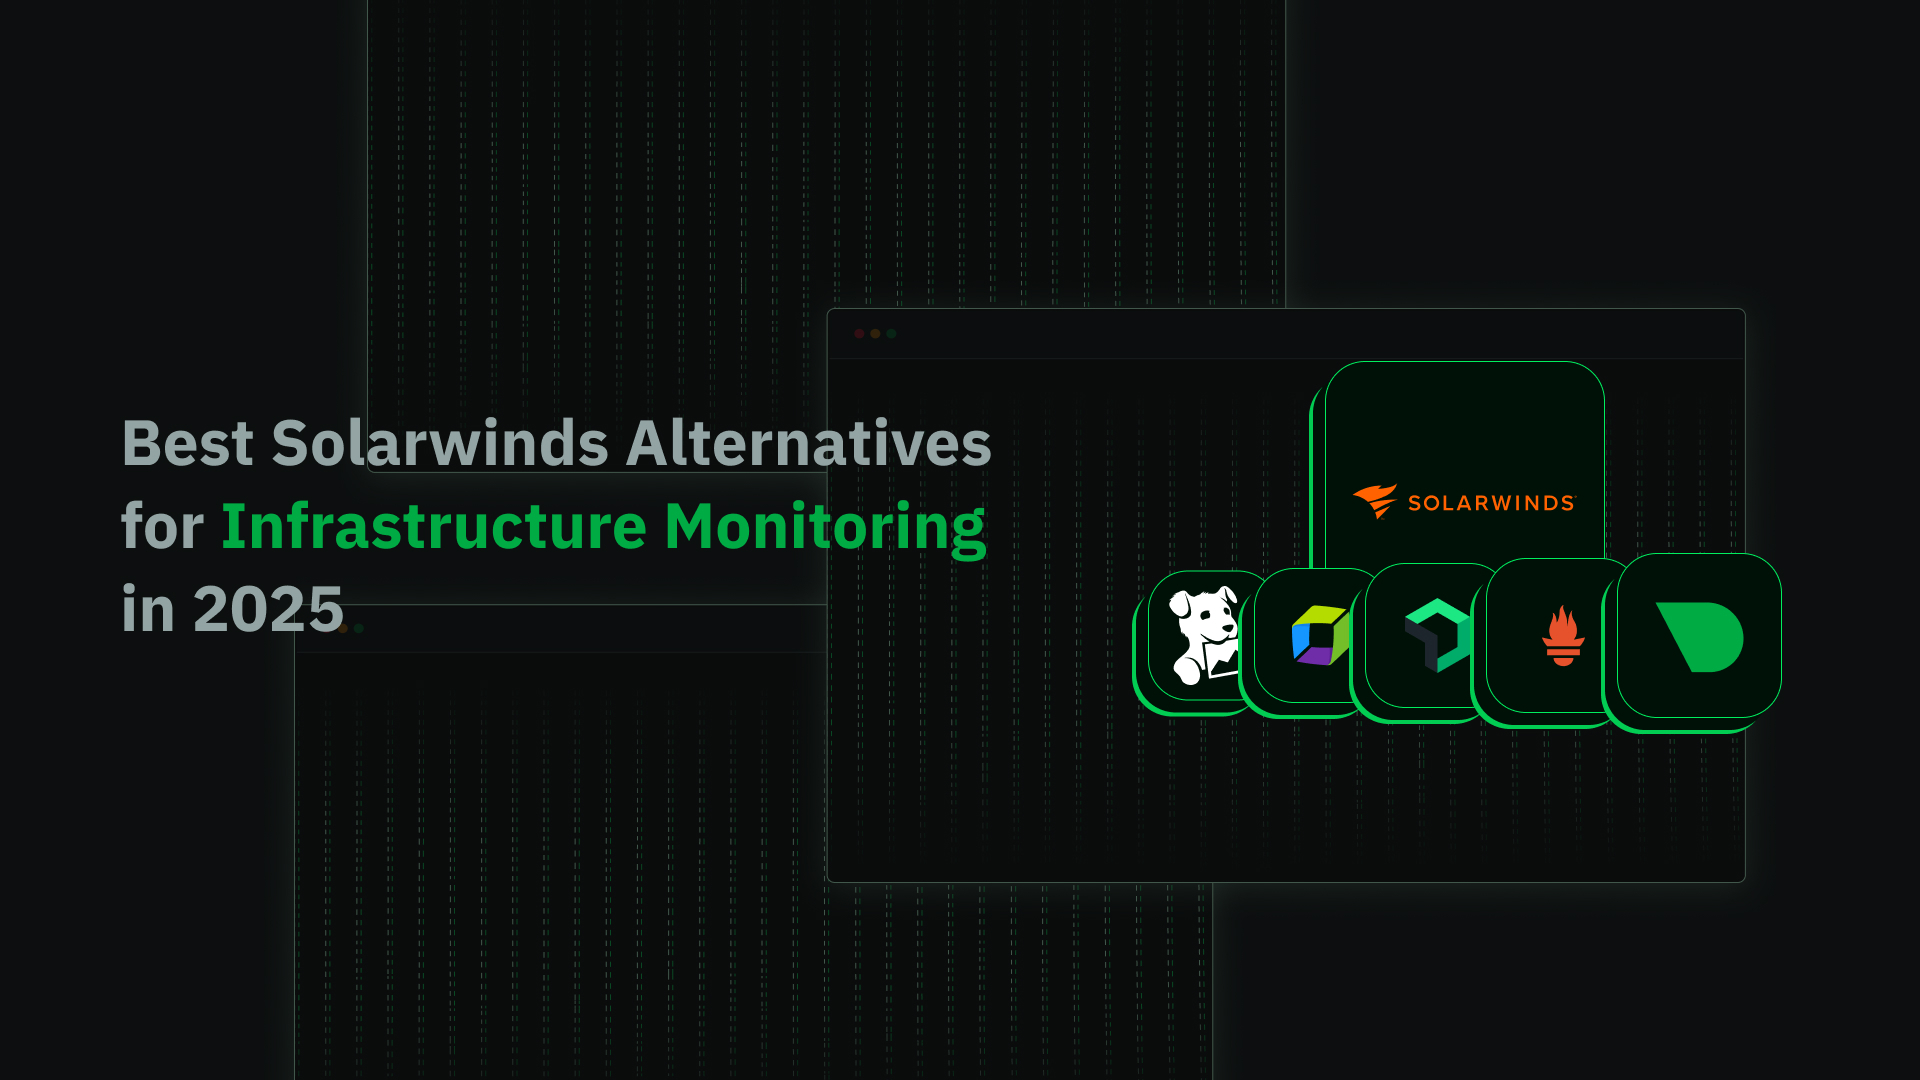
Discover the 5 best SolarWinds alternatives for 2026, built for the cloud-native, dynamic infrastructure legacy tools can't handle. Read the guide now!