The only agent that thinks for itself

Autonomous Monitoring with self-learning AI built-in, operating independently across your entire stack.

Unlimited Metrics & Logs
Machine learning & MCP
5% CPU, 150MB RAM
3GB disk, >1 year retention
800+ integrations, zero config
Dashboards, alerts out of the box
> Discover Netdata Agents

Centralized metrics streaming and storage

Aggregate metrics from multiple agents into centralized Parent nodes for unified monitoring across your infrastructure.

Stream from unlimited agents
Long-term data retention
High availability clustering
Data replication & backup
Scalable architecture
Enterprise-grade security
> Learn about Parents

Fully managed cloud platform

Access your monitoring data from anywhere with our SaaS platform. No infrastructure to manage, automatic updates, and global availability.

Zero infrastructure management
99.9% uptime SLA
Global data centers
Automatic updates & patches
Enterprise SSO & RBAC
SOC2 & ISO certified
> Explore Netdata Cloud

Deploy Netdata Cloud in your infrastructure

Run the full Netdata Cloud platform on-premises for complete data sovereignty and compliance with your security policies.

Complete data sovereignty
Air-gapped deployment
Custom compliance controls
Private network integration
Dedicated support team
Kubernetes & Docker support
> Learn about Cloud On-Premises

Powerful, intuitive monitoring interface

Modern, responsive UI built for real-time troubleshooting with customizable dashboards and advanced visualization capabilities.

Real-time chart updates
Customizable dashboards
Dark & light themes
Advanced filtering & search
Responsive on all devices
Collaboration features
> Explore Netdata UI

Monitor on the go

Native iOS and Android apps bring full monitoring capabilities to your mobile device with real-time alerts and notifications.

iOS & Android apps
Push notifications
Touch-optimized interface
Offline data access
Biometric authentication
Widget support
> Download apps

The future of infrastructure observability

See our strategic direction across AI-native observability, full-stack signals, operational intelligence, and enterprise platform maturity.

AI-native observability
Full-stack signal coverage
Operational intelligence
Enterprise platform maturity
Agent releases every 6 weeks
Cloud continuous delivery
> Explore Product Roadmap

Best energy efficiency

True real-time per-second

100% automated zero config

Centralized observability

Multi-year retention

High availability built-in

Zero maintenance

Always up-to-date

Enterprise security

Complete data control

Air-gap ready

Compliance certified

Millisecond responsiveness

Infinite zoom & pan

Works on any device

Native performance

Instant alerts

Monitor anywhere

AI-native observability

Continuous delivery

Open source foundation

80% Faster Incident Resolution

AI-powered troubleshooting from detection, to root cause and blast radius identification, to reporting.

True Real-Time and Simple, even at Scale

Linearly and infinitely scalable full-stack observability, that can be deployed even mid-crisis.

90% Cost Reduction, Full Fidelity

Instead of centralizing the data, Netdata distributes the code, eliminating pipelines and complexity.

See and Map Your Entire Network

Live topology, flow analytics, and SNMP device and trap monitoring — unified with your full-stack observability.

Control Without Surrender

SOC 2 Type 2 certified with every metric kept on your infrastructure.

Integrations

800+ collectors and notification channels, auto-discovered and ready out of the box.

800+ data collectors
Auto-discovery & zero config
Cloud, infra, app protocols
Notifications out of the box
> Explore integrations
Real Results
46% Cost Reduction

Reduced monitoring costs by 46% while cutting staff overhead by 67%.

— Leonardo Antunez, Codyas

Zero Pipeline

No data shipping. No central storage costs. Query at the edge.

From Our Users
"Out-of-the-Box"

So many out-of-the-box features! I mostly don't have to develop anything.

— Simon Beginn, LANCOM Systems

No Query Language

Point-and-click troubleshooting. No PromQL, no LogQL, no learning curve.

Enterprise Ready
67% Less Staff, 46% Cost Cut

Enterprise efficiency without enterprise complexity—real ROI from day one.

— Leonardo Antunez, Codyas

SOC 2 Type 2 Certified

Zero data egress. Only metadata reaches the cloud. Your metrics stay on your infrastructure.

Full Coverage
800+ Collectors

Auto-discovered and configured. No manual setup required.

Any Notification Channel

Slack, PagerDuty, Teams, email, webhooks—all built-in.

Built for the People Who Get Paged

Because 3am alerts deserve instant answers, not hour-long hunts.

Every Industry Has Rules. We Master Them.

See how healthcare, finance, and government teams cut monitoring costs 90% while staying audit-ready.

Monitor Any Technology. Configure Nothing.

Install the agent. It already knows your stack.
From Our Users
"A Rare Unicorn"

Netdata gives more than you invest in it. A rare unicorn that obeys the Pareto rule.

— Eduard Porquet Mateu, TMB Barcelona

99% Downtime Reduction

Reduced website downtime by 99% and cloud bill by 30% using Netdata alerts.

— Falkland Islands Government

Real Savings
30% Cloud Cost Reduction

Optimized resource allocation based on Netdata alerts cut cloud spending by 30%.

— Falkland Islands Government

46% Cost Cut

Reduced monitoring staff by 67% while cutting operational costs by 46%.

— Codyas

Real Coverage
"Plugin for Everything"

Netdata has agent capacity or a plugin for everything, including Windows and Kubernetes.

— Eduard Porquet Mateu, TMB Barcelona

"Out-of-the-Box"

So many out-of-the-box features! I mostly don't have to develop anything.

— Simon Beginn, LANCOM Systems

Real Speed
Troubleshooting in 30 Seconds

From 2-3 minutes to 30 seconds—instant visibility into any node issue.

— Matthew Artist, Nodecraft

20% Downtime Reduction

20% less downtime and 40% budget optimization from out-of-the-box monitoring.

— Simon Beginn, LANCOM Systems

Pay per Node. Unlimited Everything Else.

One price per node. Unlimited metrics, logs, users, and retention. No per-GB surprises.

Free tier—forever
No metric limits or caps
Retention you control
Cancel anytime
> See pricing plans

What's Your Monitoring Really Costing You?

Most teams overpay by 40-60%. Let's find out why.

Expose hidden metric charges
Calculate tool consolidation
Customers report 30-67% savings
Results in under 60 seconds
> See what you're really paying

Your Infrastructure Is Unique. Let's Talk.

Because monitoring 10 nodes is different from monitoring 10,000.

On-prem & air-gapped deployment
Volume pricing & agreements
Architecture review for your scale
Compliance & security support
> Start a conversation

Monitoring That Sells Itself

Deploy in minutes. Impress clients in hours. Earn recurring revenue for years.

30-second live demos close deals
Zero config = zero support burden
Competitive margins & deal protection
Response in 48 hours
> Apply to partner

Per-Second Metrics at Homelab Prices

Same engine, same dashboards, same ML. Just priced for tinkerers.

Community: Free forever · 5 nodes · non-commercial
Homelab: $90/yr · unlimited nodes · fair usage
> Get the Homelab Plan

$1,000 Per Referral. Unlimited Referrals.

Your colleagues get 10% off. You get 10% commission. Everyone wins.

10% of subscriptions, up to $1,000 each
Track earnings inside Netdata Cloud
PayPal/Venmo payouts in 3-4 weeks
No caps, no complexity
> Get your referral link
Cost Proof
40% Budget Optimization

"Netdata's significant positive impact" — LANCOM Systems

Calculate Your Savings

Compare vs Datadog, Grafana, Dynatrace

Savings Proof
46% Cost Reduction

"Cut costs by 46%, staff by 67%" — Codyas

30% Cloud Bill Savings

"Reduced cloud bill by 30%" — Falkland Islands Gov

Enterprise Proof
"Better Than Combined Alternatives"

"Better observability with Netdata than combining other tools." — TMB Barcelona

Real Engineers, <24h Response

DPA, SLAs, on-prem, volume pricing

Why Partners Win
Demo Live Infrastructure

One command, 30 seconds, real data—no sandbox needed

Zero Tickets, High Margins

Auto-config + per-node pricing = predictable profit

Homelab Ready
Free Video Course

8-episode Netdata tutorial by LearnLinux.tv

76k+ GitHub Stars

3rd most starred monitoring project

Worth Recommending
Product That Delivers

Customers report 40-67% cost cuts, 99% downtime reduction

Zero Risk to Your Rep

Free tier lets them try before they buy

AI Support Assistant, Available 24/7

Nedi has access to all official documentation, source code, and resources. Ask any question about Netdata—responds in your language.

Deployment & configuration
Troubleshooting & sizing
Alerts & notifications
Evidence-based answers
> Ask Nedi now

Never Fight Fires Alone

Docs, community, and expert help—pick your path to resolution.

Learn.netdata.cloud docs
Discord, Forums, GitHub
Premium support available
> Get answers now

60 Seconds to First Dashboard

One command to install. Zero config. 850+ integrations documented.

Linux, Windows, K8s, Docker
Auto-discovers your stack
> Read our documentation

Level Up Your Monitoring

Real problems. Real solutions. 112+ guides from basic monitoring to AI observability.

76,000+ Engineers Strong

615+ contributors. 1.5M daily downloads. One mission: simplify observability.

Per-Second. 90% Cheaper. Data Stays Home.

Side-by-side comparisons: costs, real-time granularity, and data sovereignty for every major tool.

See why teams switch from Datadog, Prometheus, Grafana, and more.

> Browse all comparisons
Edge-Native Observability, Born Open Source
Per-second visibility, ML on every metric, and data that never leaves your infrastructure.
Founded in 2016
615+ contributors worldwide
Remote-first, engineering-driven
Open source first
> Read our story
Promises We Publish—and Prove
12 principles backed by open code, independent validation, and measurable outcomes.
Open source, peer-reviewed
Zero config, instant value
Data sovereignty by design
Aligned pricing, no surprises
> See all 12 principles
Edge-Native, AI-Ready, 100% Open
76k+ stars. Full ML, AI, and automation—GPLv3+, not premium add-ons.
76,000+ GitHub stars
GPLv3+ licensed forever
ML on every metric, included
Zero vendor lock-in
> Explore our open source
Build Real-Time Observability for the World
Remote-first team shipping per-second monitoring with ML on every metric.
Remote-first, fully distributed
Open source (76k+ stars)
Challenging technical problems
Your code on millions of systems
> See open roles
Meet the Team Behind Netdata
Conferences, meetups, and tradeshows where you can see Netdata in action and talk to the engineers who build it.
Live demos and deep dives
Book 1-on-1 meetings
Talks and panel sessions
Event recaps and photos
> See all events
Talk to a Netdata Human in <24 Hours
Sales, partnerships, press, or professional services—real engineers, fast answers.
Discuss your observability needs
Pricing and volume discounts
Partnership opportunities
Media and press inquiries
> Book a conversation
Your Data. Your Rules.
On-prem data, cloud control plane, transparent terms.
Trust & Scale
76,000+ GitHub Stars

One of the most popular open-source monitoring projects

SOC 2 Type 2 Certified

Enterprise-grade security and compliance

Data Sovereignty

Your metrics stay on your infrastructure

Validated
University of Amsterdam

"Most energy-efficient monitoring solution" — ICSOC 2023, peer-reviewed

ADASTEC (Autonomous Driving)

"Doesn't miss alerts—mission-critical trust for safety software"

Community Stats
615+ Contributors

Global community improving monitoring for everyone

1.5M+ Downloads/Day

Trusted by teams worldwide

GPLv3+ Licensed

Free forever, fully open source agent

Why Join?
Remote-First

Work from anywhere, async-friendly culture

Impact at Scale

Your work helps millions of systems

Retail POS and Kiosk Fleet Monitoring

See Every Terminal. Catch Every Freeze. Before Checkout Fails.

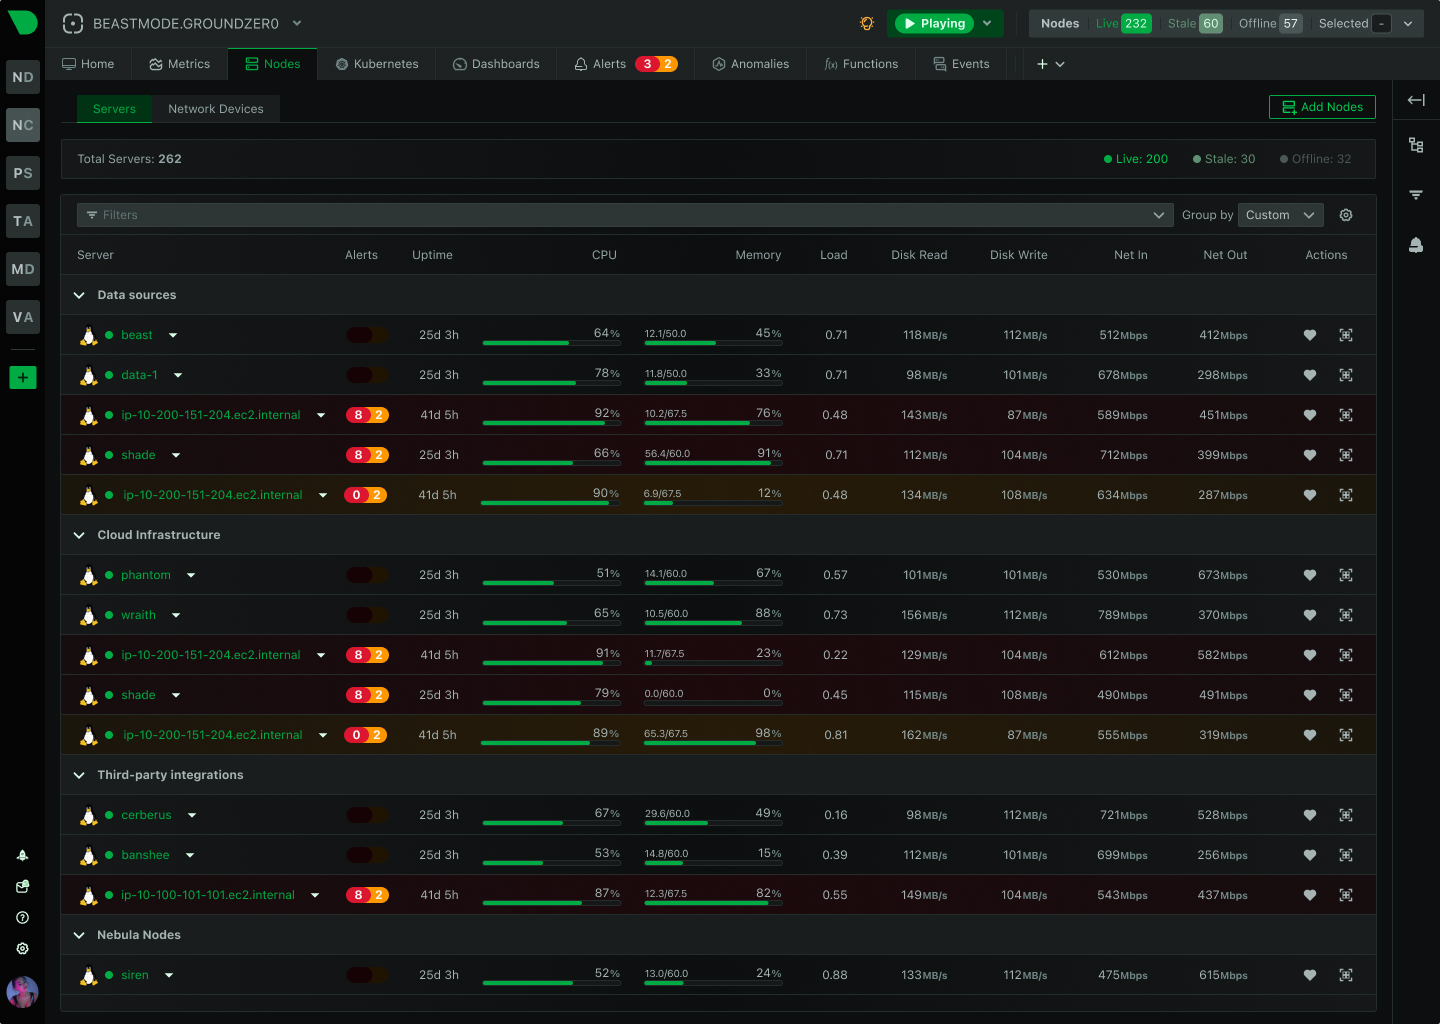
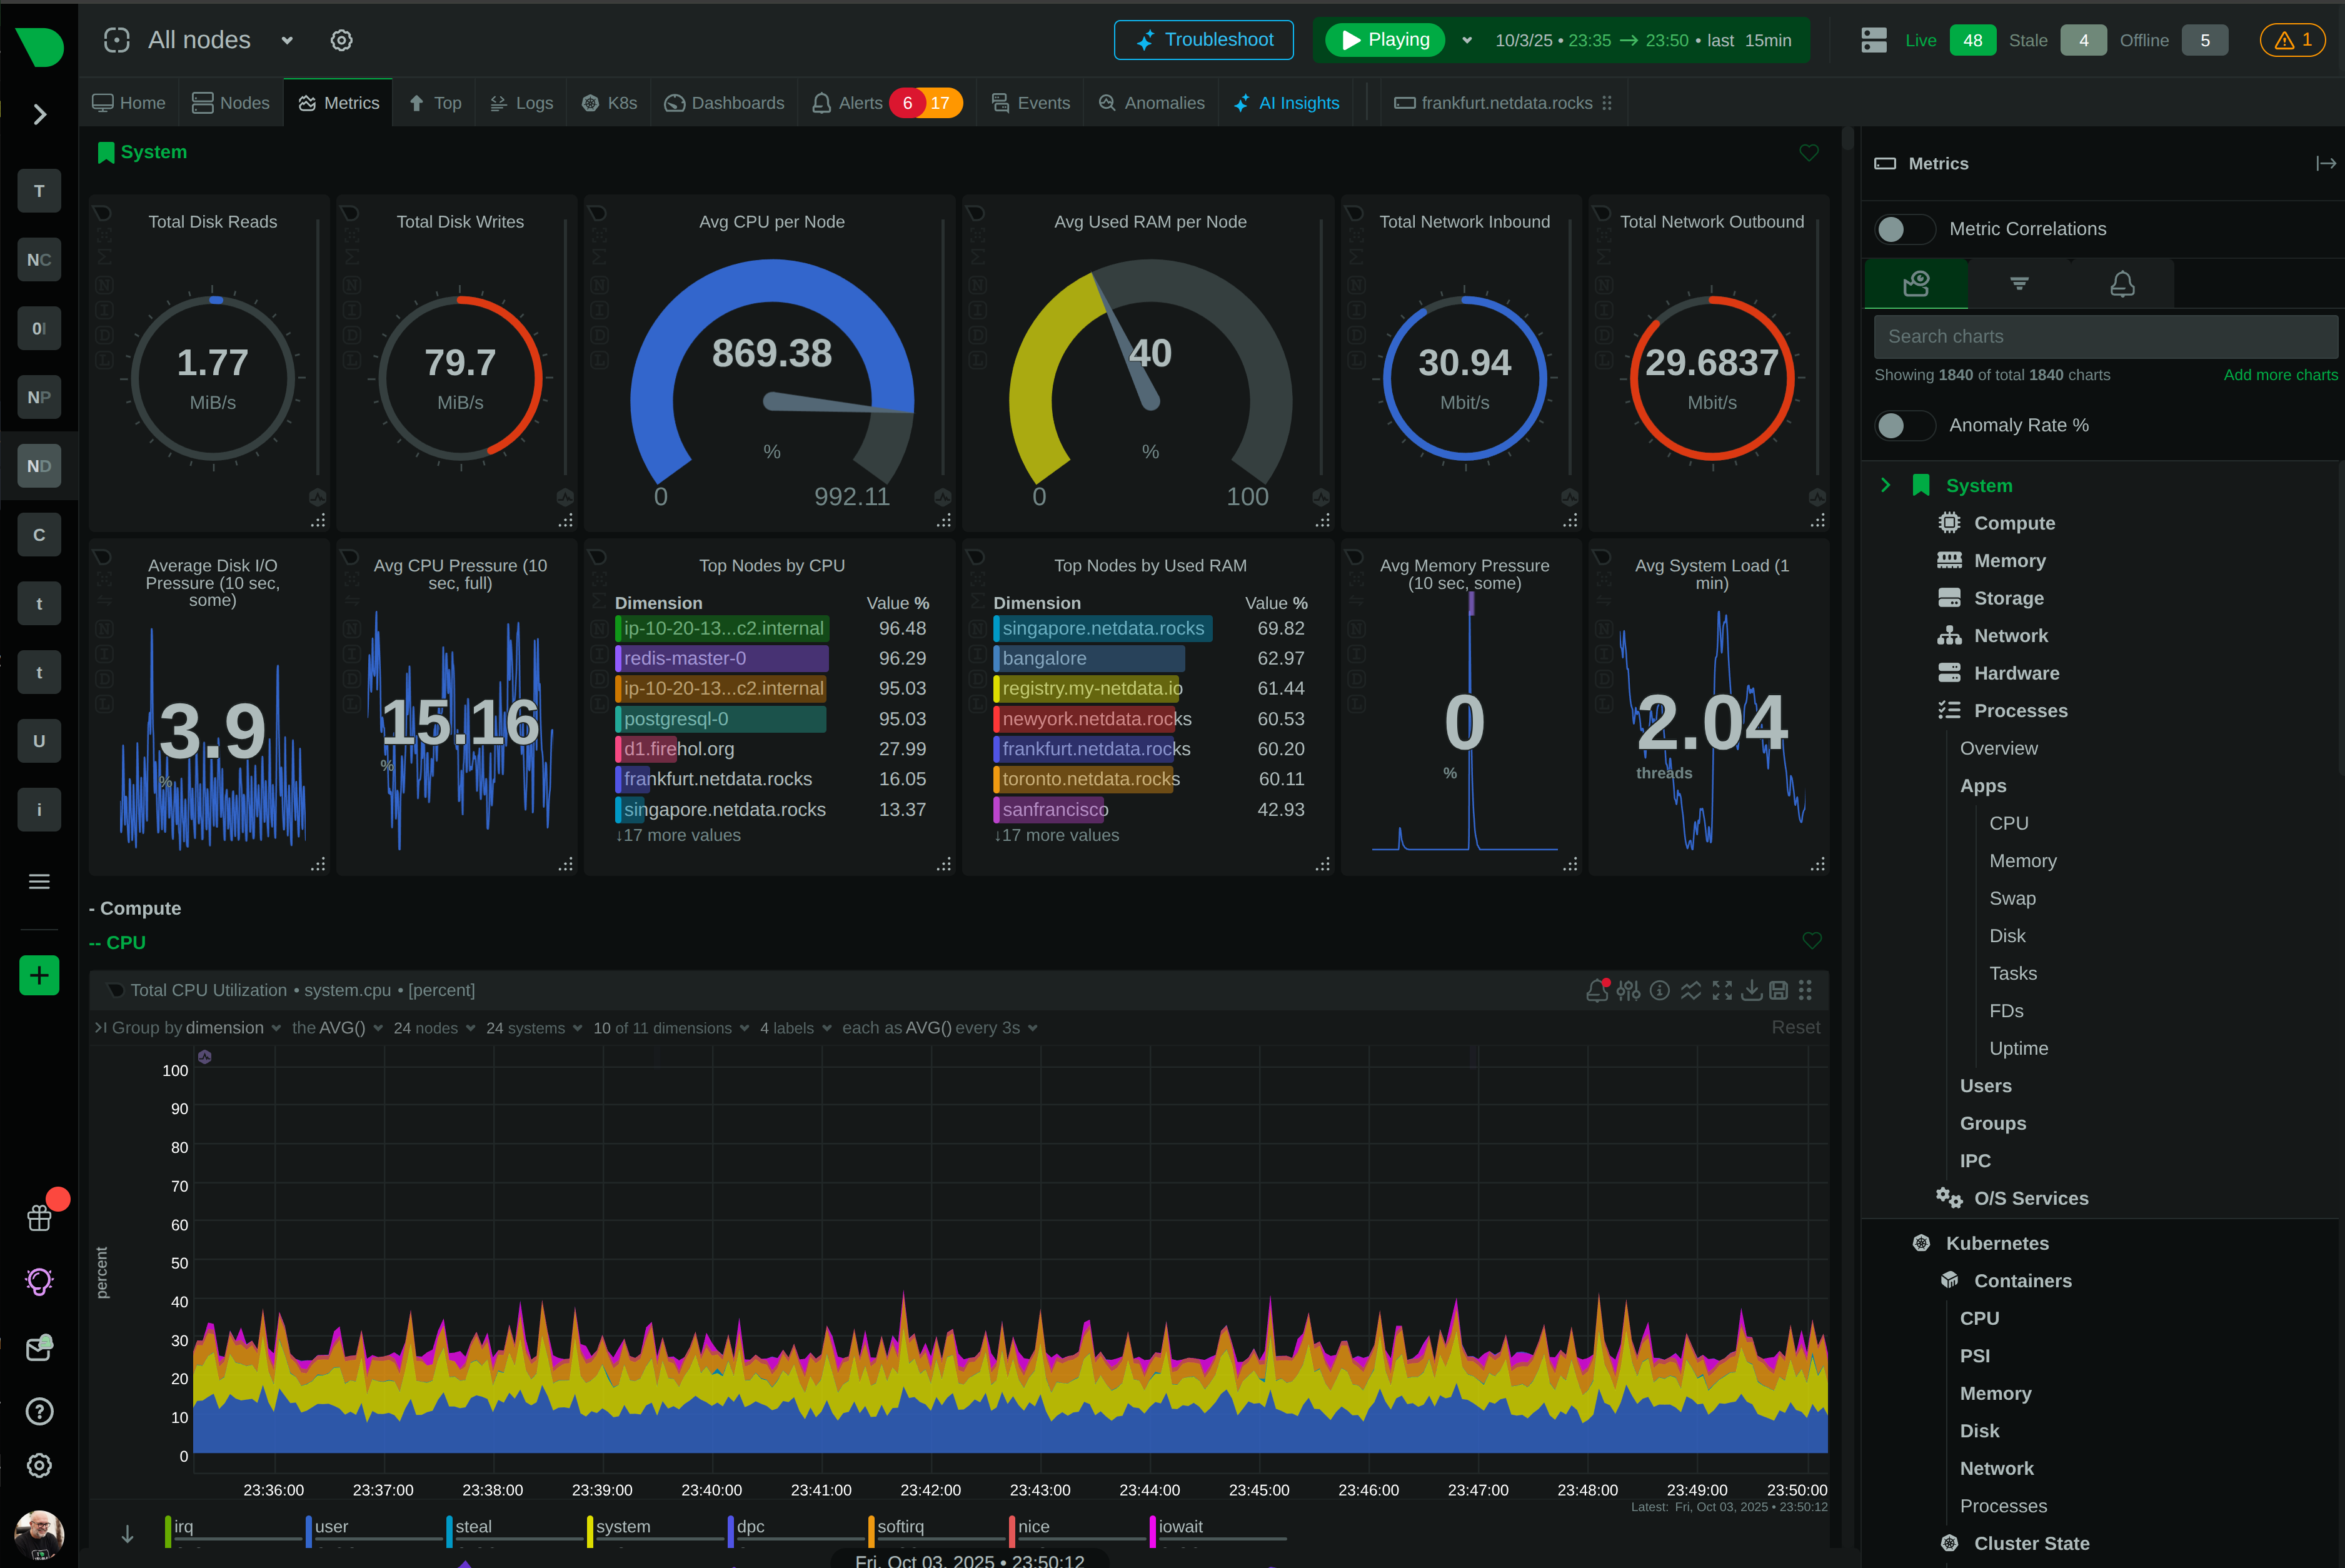
Netdata runs on every POS terminal and self-service kiosk, collecting per-second metrics on CPU, memory, disk, network, and the point-of-sale process itself. Thousands of stores stay observable even on flaky in-store networks, because the intelligence lives on the device, not in a distant cloud.

Background Hero

Built for Thousands of Store Endpoints

Every metric you need to keep checkout running, collected per-second on the device itself.

Per-Terminal Visibility

CPU saturation, memory leaks in the POS app, disk filling, and peripheral health — every terminal monitored individually at per-second resolution.

Anomaly Detection On Every Device

18 unsupervised ML models train locally on each terminal, flagging behavioral changes before a freeze or crash disrupts a transaction.

Survives Flaky In-Store Networks

Agents buffer locally during WAN drops and backfill Parents when links return. Monitoring never stops, even when the store network does.

POS Process Health

Track the point-of-sale or kiosk application process itself — crashes, restarts, resource consumption, and the OS faults that precede them.

Data Stays On-Site

All metrics and logs remain on the device or within your infrastructure. Only metadata reaches Netdata Cloud for unified fleet dashboards.

Predictable Per-Node Economics

Simple per-terminal pricing that scales linearly across thousands of stores. No metric volume charges, no ingestion fees, no surprise bills.

Trusted by retail and fleet operators worldwide

Catch Terminal Trouble Before It Becomes Lost Revenue

Per-Second Insight Into Every Endpoint

A frozen terminal or down kiosk is lost revenue and a damaged customer experience. Netdata collects CPU, memory, disk I/O, network interfaces, and per-process data at one-second granularity on every device — so you see the resource spike that precedes a freeze, not just the outage report afterward.

80% faster MTTR

Explore real-time monitoring

Per-Second Insight Into Every Endpoint

Resilient Monitoring Across Unreliable Store Networks

Retail networks are not datacenter networks. Store links drop, MPLS tunnels flap, and satellite backhauls degrade. Netdata Agents continue collecting, storing, and running anomaly detection locally during any network partition, then stream buffered data to regional Parents the moment connectivity returns. Zero blind spots.

Zero data loss on WAN drops

See how edge resilience works

Resilient Monitoring Across Unreliable Store Networks

Know Which Terminal Is Headed for Trouble

Each terminal gets its own ML baseline. When a POS app starts leaking memory, when disk fills faster than usual, or when network drops to payment backends spike, anomaly detection flags it immediately — ranked across the entire fleet so your team knows exactly which store and which device needs attention right now.

Root cause in top 30-50 metrics

Discover Anomaly Advisor

Know Which Terminal Is Headed for Trouble

Fleet Economics That Scale to Thousands of Stores

Centralized SaaS monitoring that ships every metric from every terminal to a distant cloud is economically wrong for retail fleets. Netdata keeps data at the edge, processes intelligence locally, and charges per node — not per metric, per log, or per gigabyte ingested. The result is predictable costs whether you run 500 terminals or 50,000.

90% cost reduction vs traditional stacks

Understand the cost model

Fleet Economics That Scale to Thousands of Stores

Console-Level Troubleshooting Without SSH

Every terminal is reachable through the dashboard. View running processes, active network connections, systemd units, and journal logs — all from your browser, with per-second history and anomaly context. Your operations team fixes kiosk issues without dispatching a technician or opening a VPN to each store.

One platform replaces ~7 tools

Explore Live troubleshooting

Console-Level Troubleshooting Without SSH

Architecture for distributed retail fleets

Edge-Resident Monitoring vs Centralized SaaS

When your infrastructure is thousands of endpoints across hundreds of stores, where data is processed determines whether monitoring is affordable, reliable, and fast enough to matter.

Capability

Netdata (Edge-Resident)

Centralized SaaS / Traditional Tools

Data Processing Location
Where intelligence runs

✅ On Each Terminal
ML, storage, alerts all run locally

⚠️ Central Cloud Backend
All telemetry shipped off-site

Metric Granularity
Resolution per terminal

✅ Per-Second (1s)
Full fidelity, zero sampling

⚠️ 15-60 Second Intervals
Averaged, often sampled

Network Outage Resilience
Behavior during WAN drops

✅ Continuous Local Collection
Buffers and backfills automatically

❌ Blind Spots
Data lost during disconnection

Anomaly Detection
ML baseline per terminal

✅ 18 Models Per Metric, On Device
Trained locally, consensus-based

⚠️ Centralized or Manual
Selected metrics, cloud-dependent

Data Sovereignty
Where telemetry lives

✅ On-Site, Under Your Control
Only metadata leaves the device

❌ Vendor Cloud
All data sent to third party

Log Management
Access to terminal logs

✅ Direct systemd-journal Access
No separate pipeline required

⚠️ Separate Log Platform
Ship, index, store at high cost

Fleet Query Speed
Cross-store dashboard latency

✅ Distributed Parallel Queries
Each node serves its own data

⚠️ Single Central Database
Bottleneck at scale

Cost Model at Fleet Scale
How pricing grows

✅ Per-Node, Predictable
No metric or ingestion charges

❌ Volume-Based
Costs explode with fleet size

Resource Footprint
Impact on the terminal

✅ Under 5% CPU, 150MB RAM
Designed for constrained devices

⚠️ Variable Overhead
Often heavier on the endpoint

What Netdata Shows You For Every Terminal

Point-of-Sale App Health

Monitor the POS or kiosk application process directly — CPU consumption, memory usage, restarts, and crash patterns. Catch the memory leak or CPU spiral before the terminal locks up mid-transaction.

Per-process visibility at one-second resolution

Learn about process monitoring
POS Process Dashboard

Frequently Asked Questions