The World’s Most Popular Open Source Monitoring Platform
Deploy complete infrastructure observability in 60 seconds. Zero configuration. Instant visibility. ML-powered insights from day one. Trusted by millions of engineers worldwide.

Deploy complete infrastructure observability in 60 seconds. Zero configuration. Instant visibility. ML-powered insights from day one. Trusted by millions of engineers worldwide.
Get the flexibility you love with the simplicity you need
One-line install. Auto-discovery. Instant dashboards. From installation to insights before your coffee gets cold.
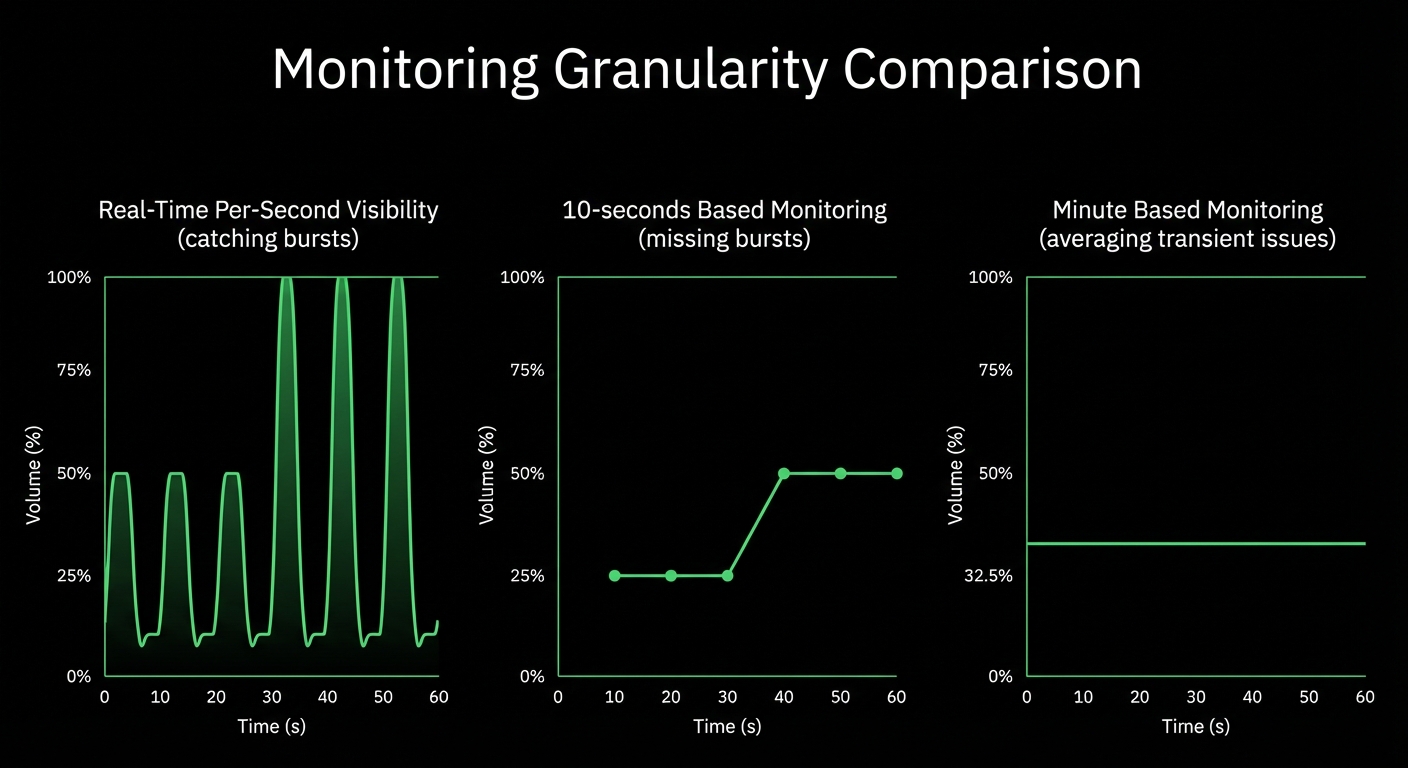
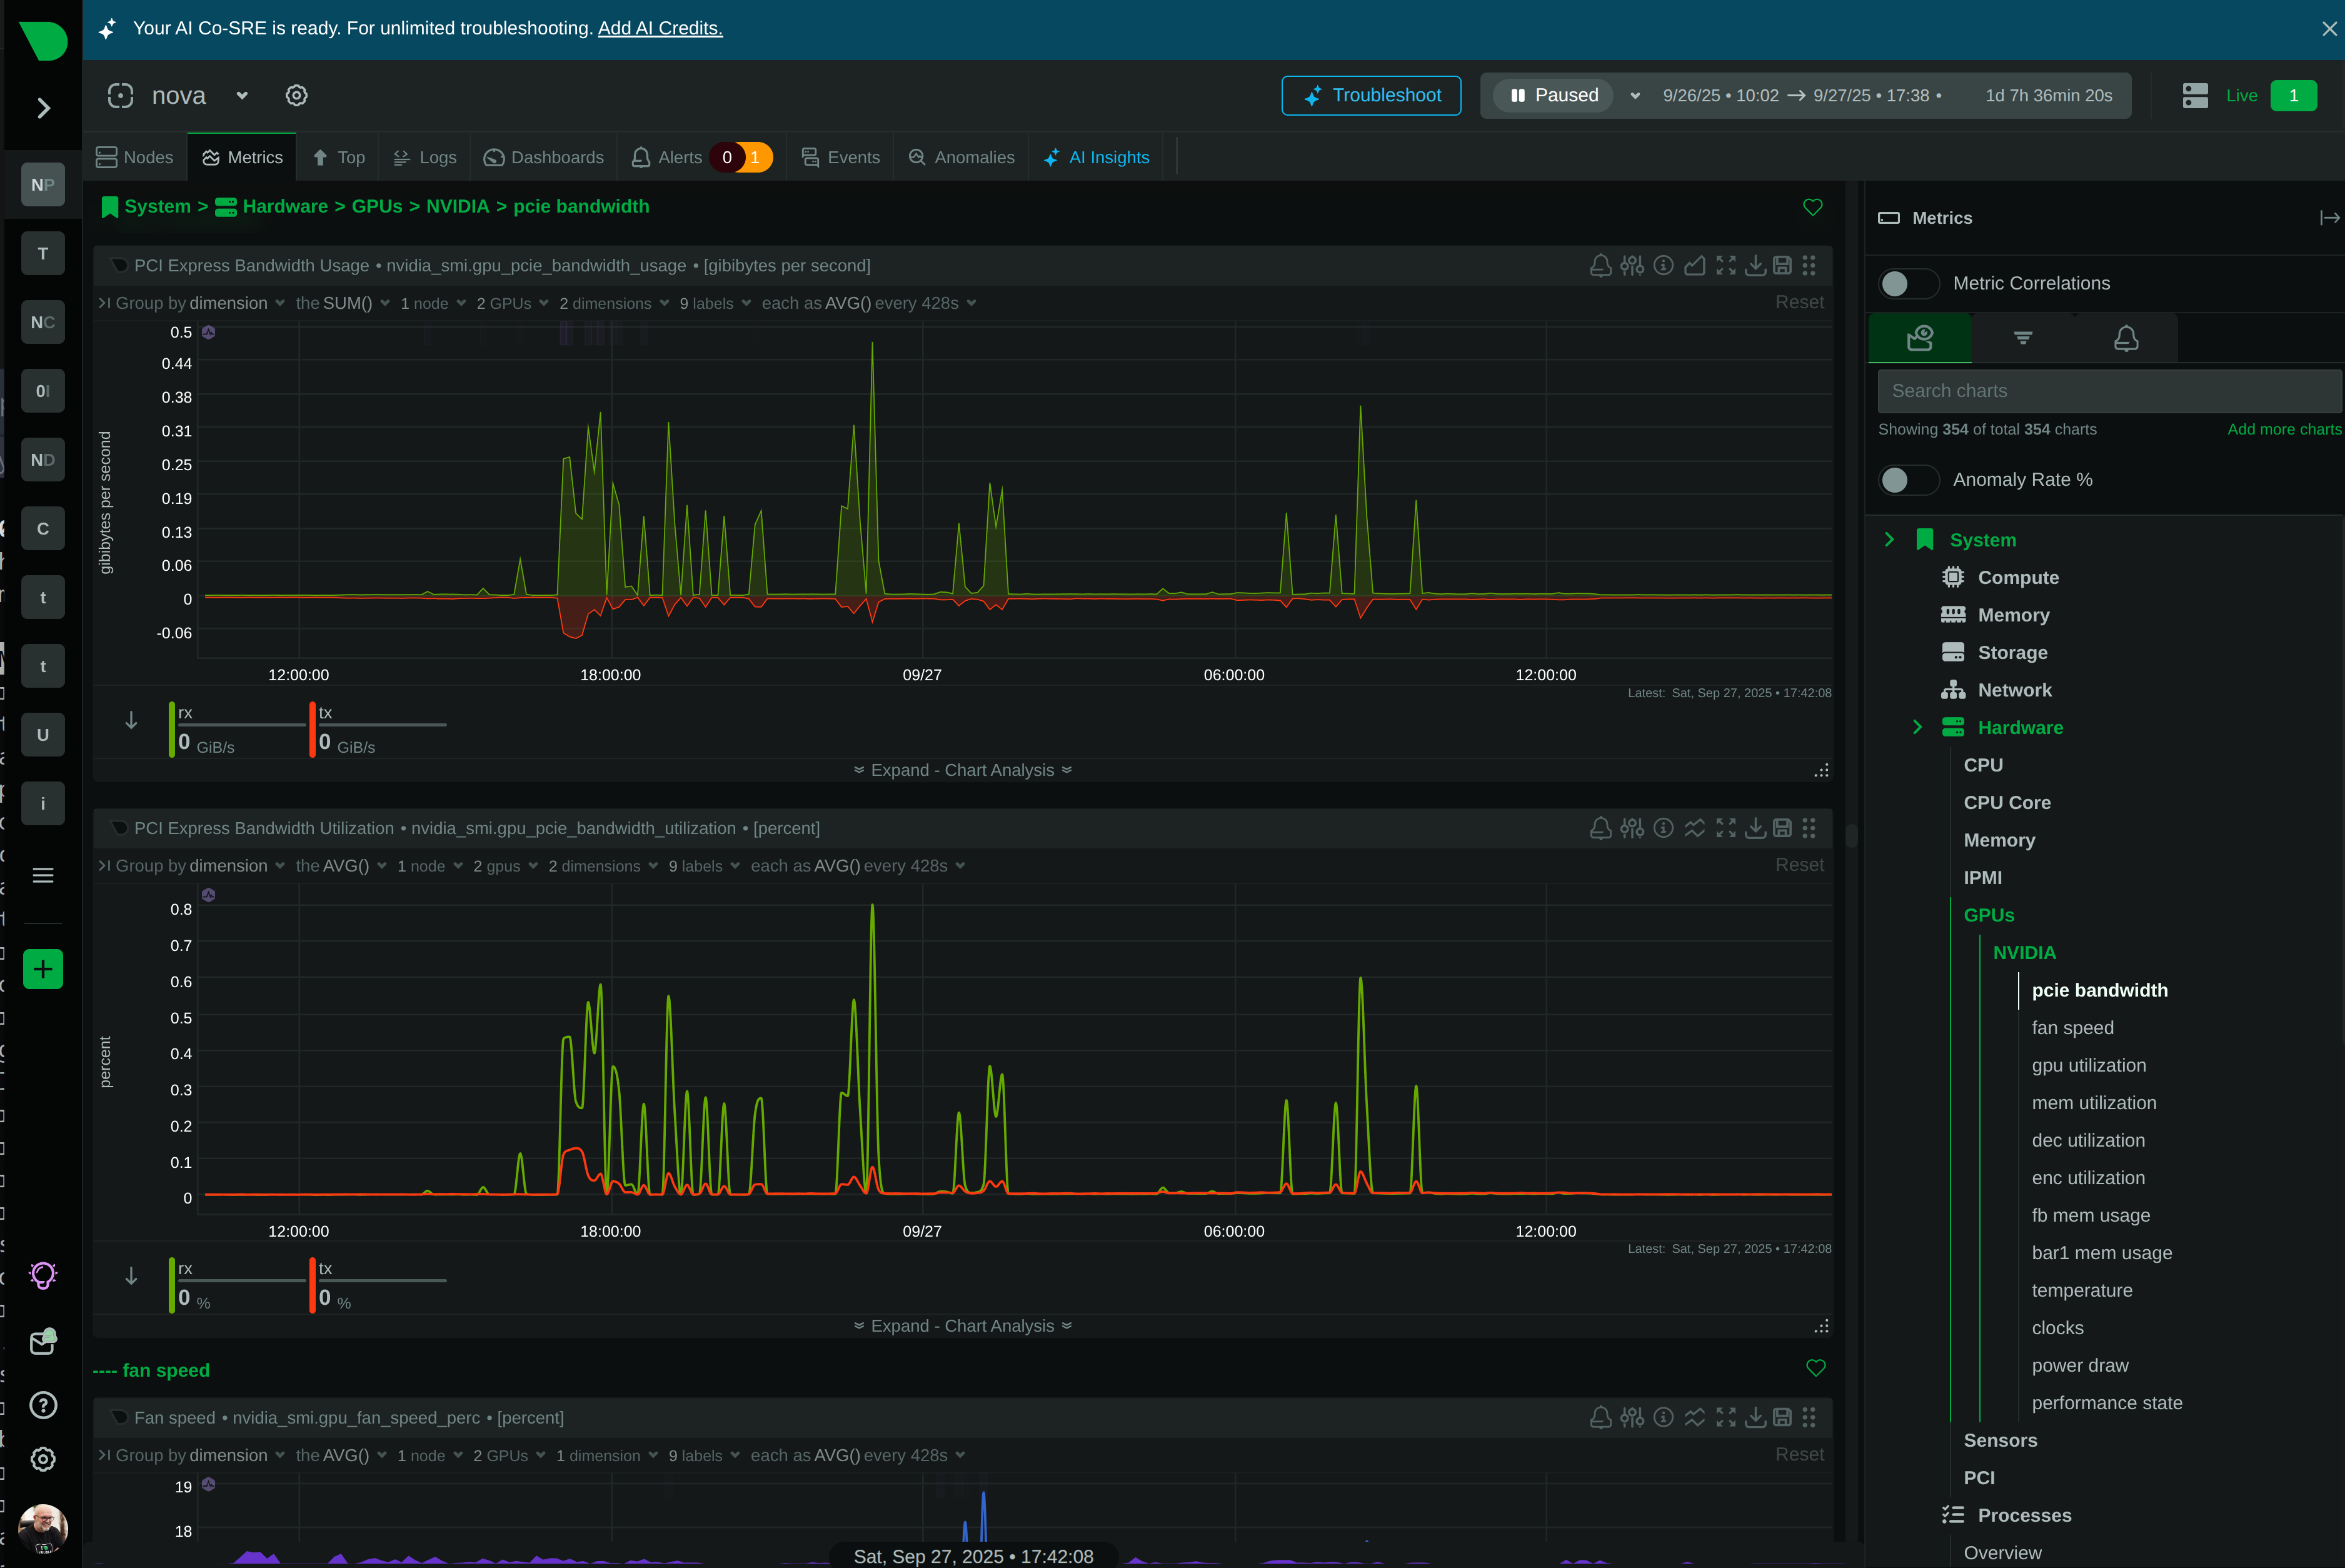
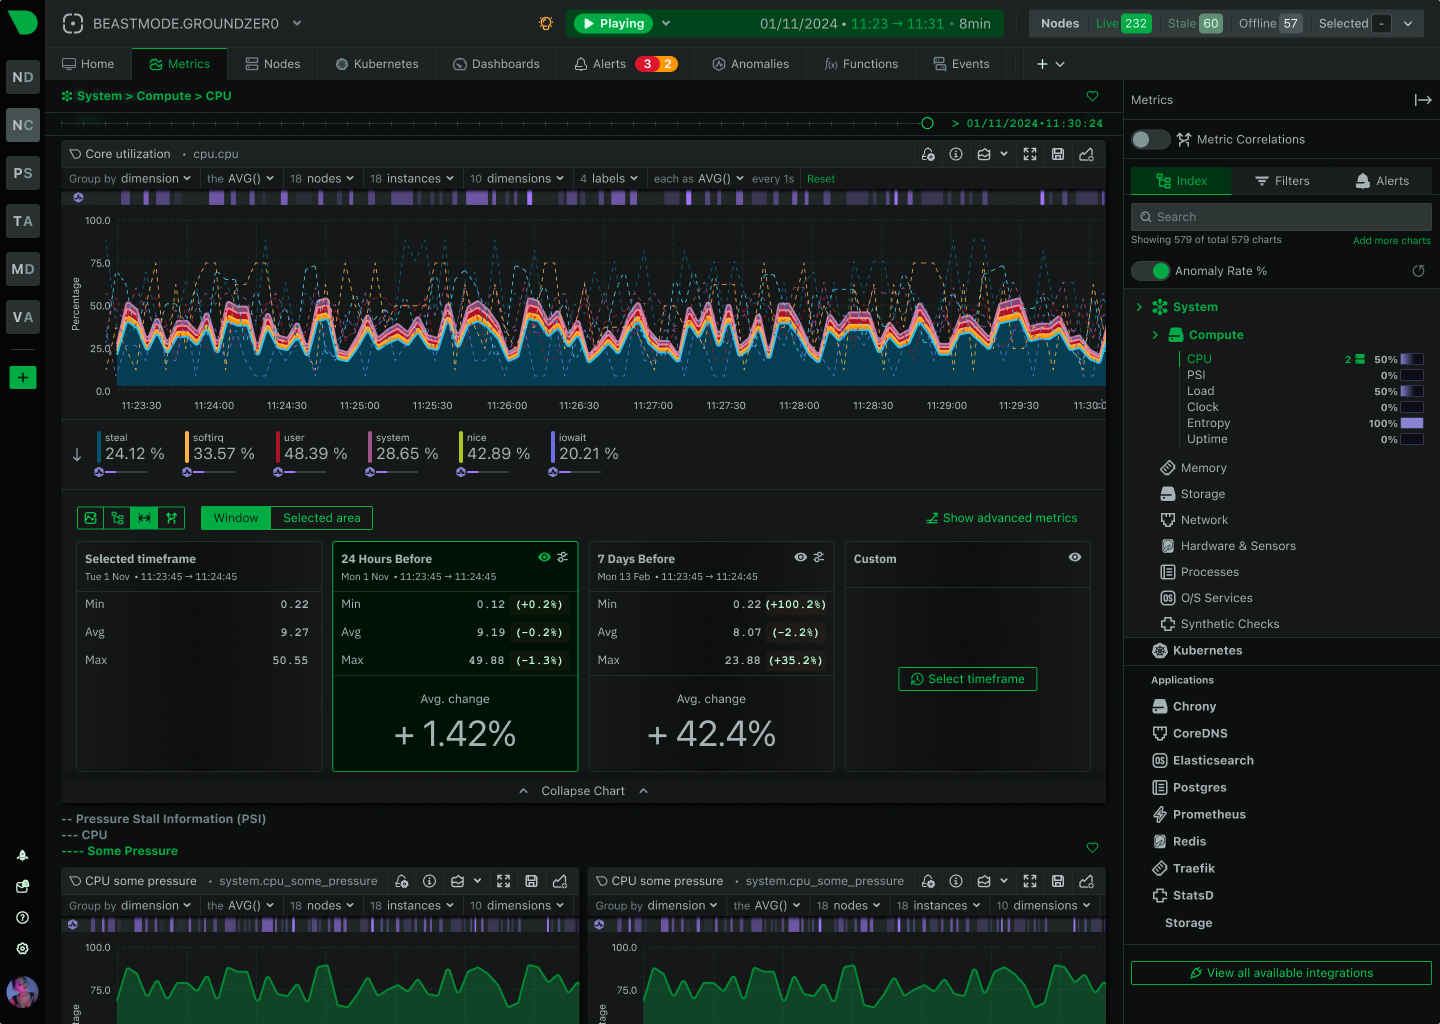
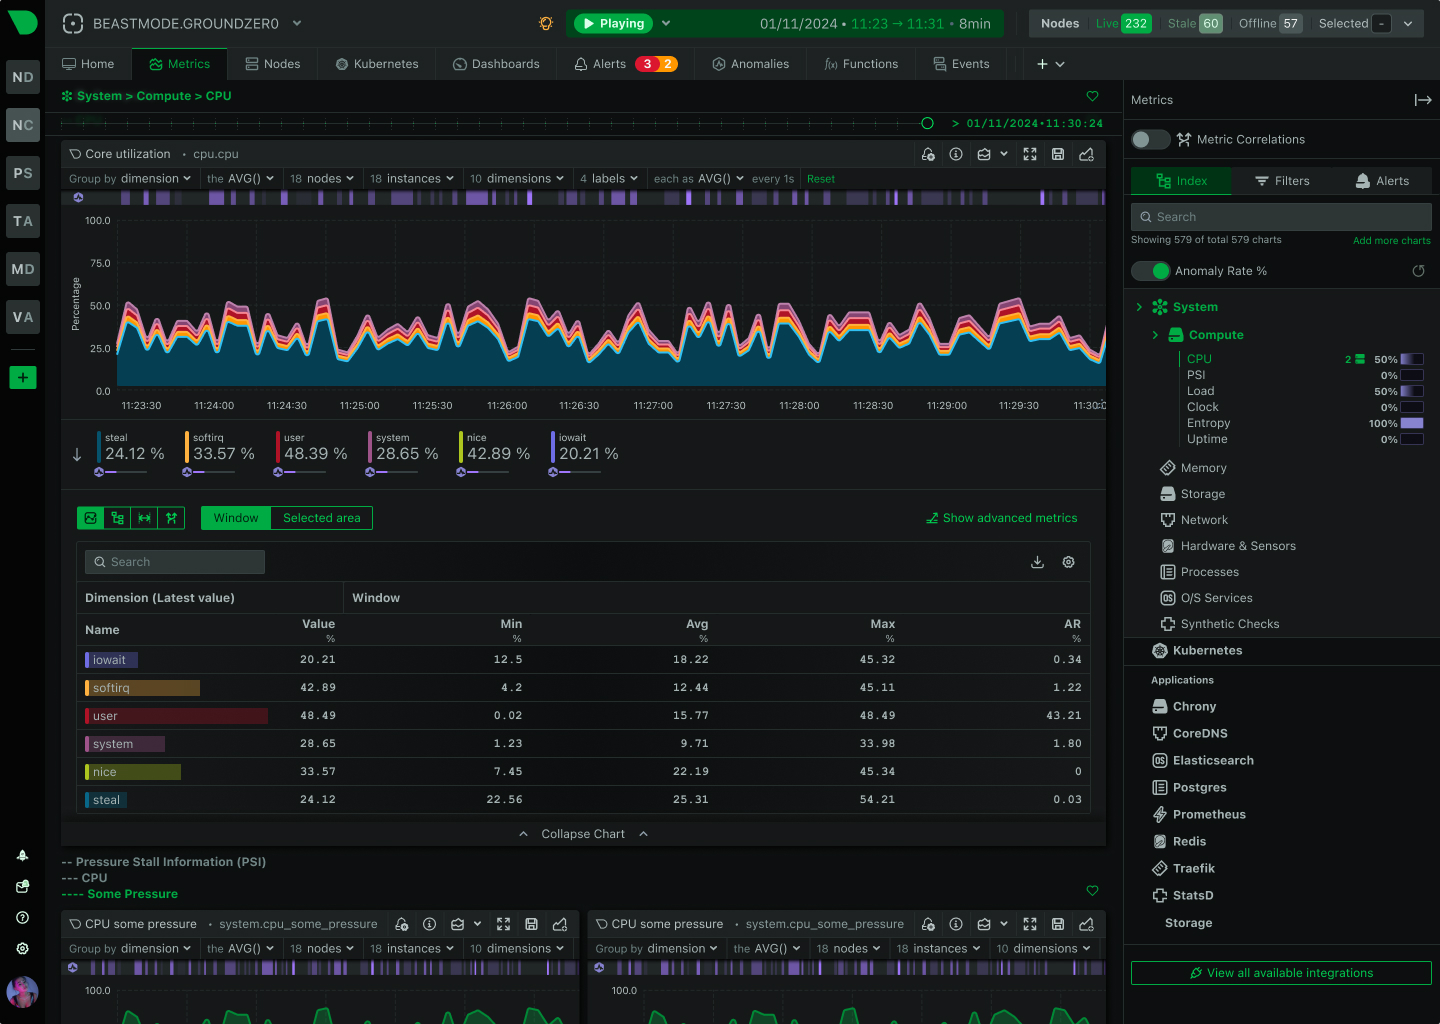
Per-second data collection with 1-second visualization latency. See what’s happening now, not what happened 30 seconds ago.
18 unsupervised models train automatically per metric. 99% false positive reduction through consensus-based anomaly detection.
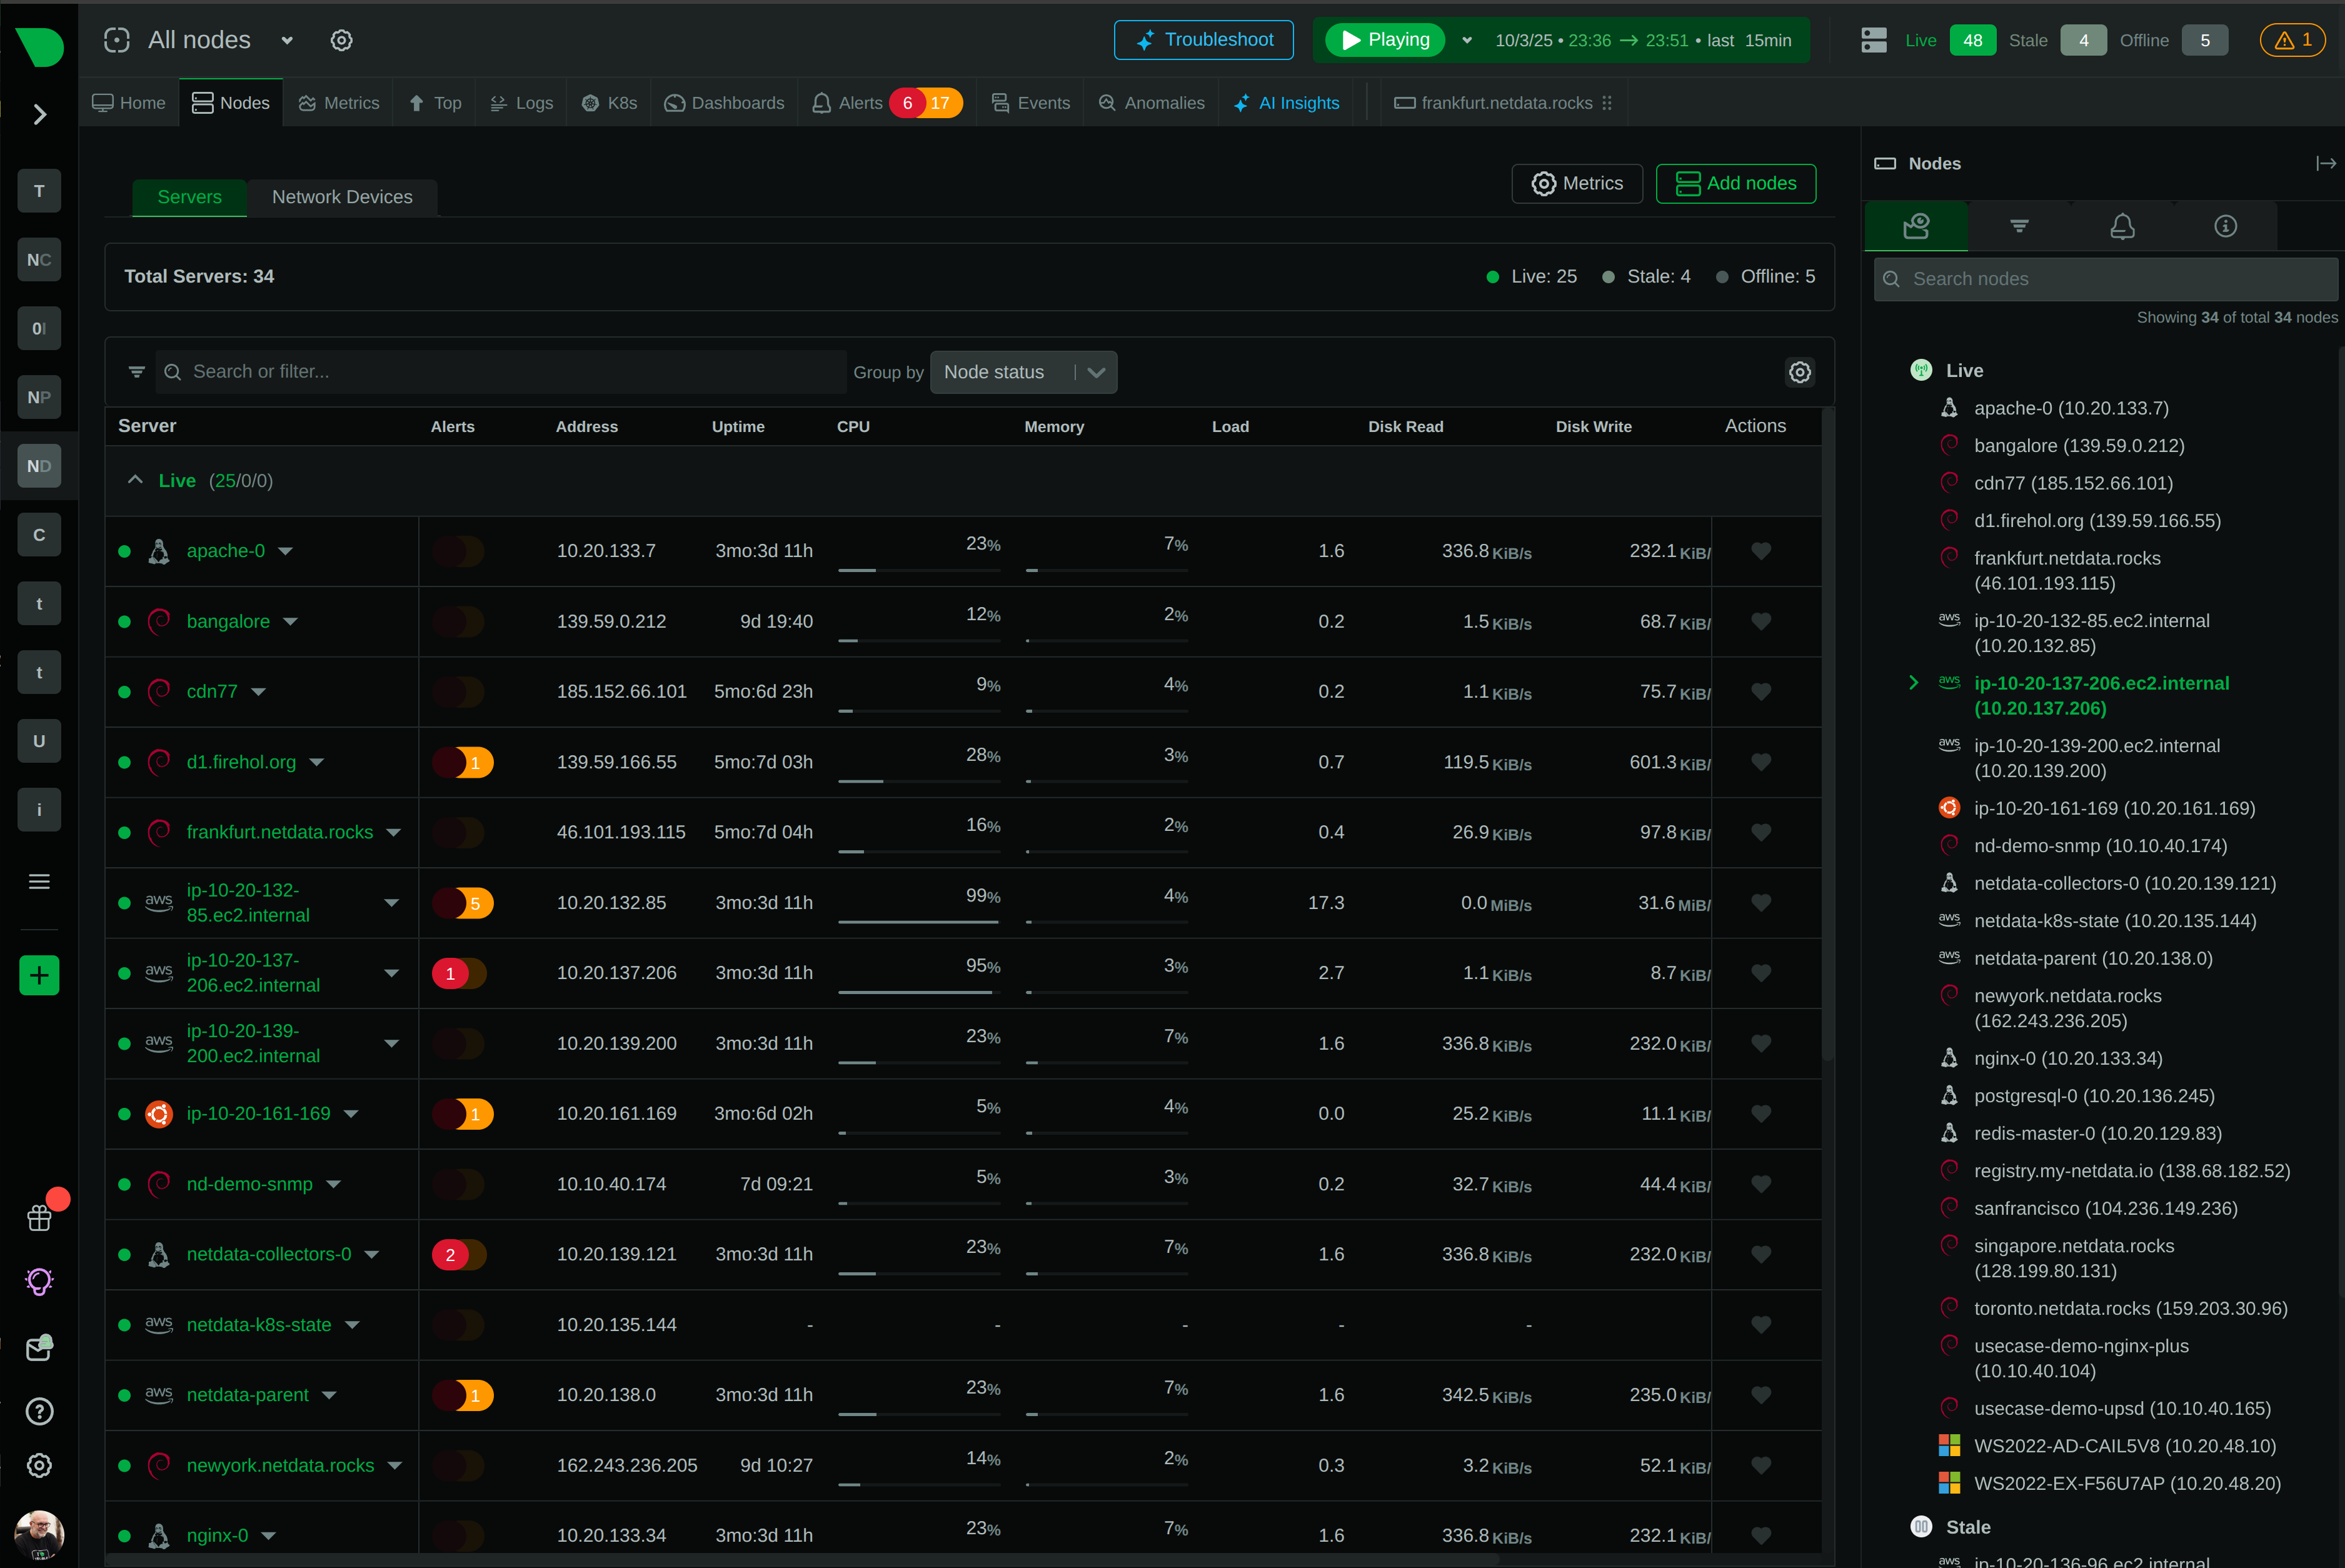
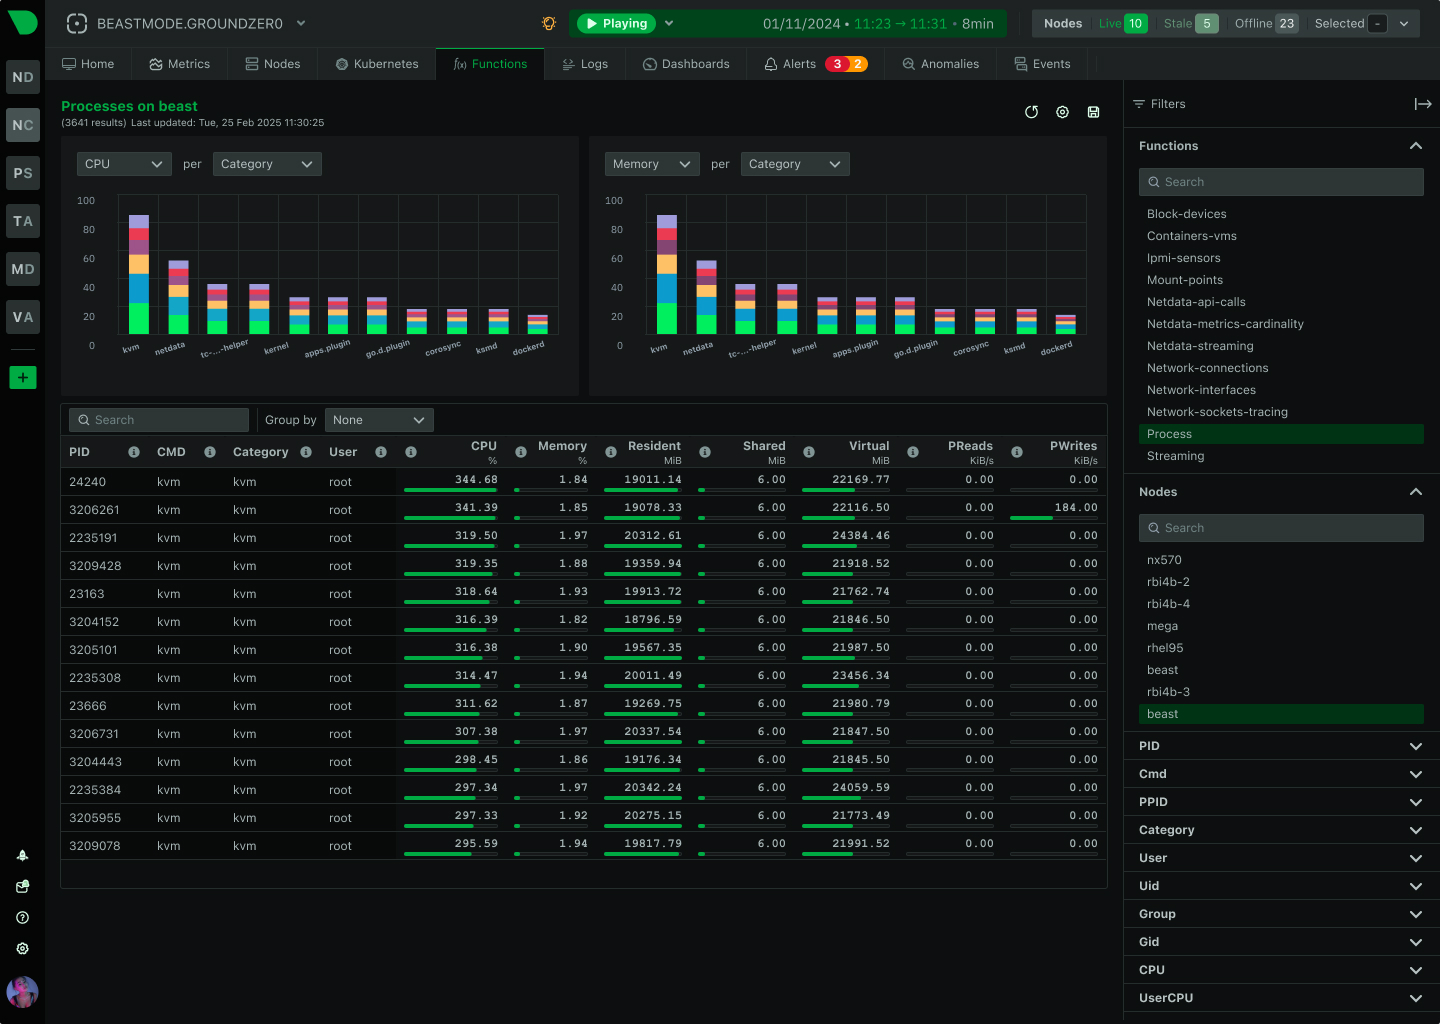
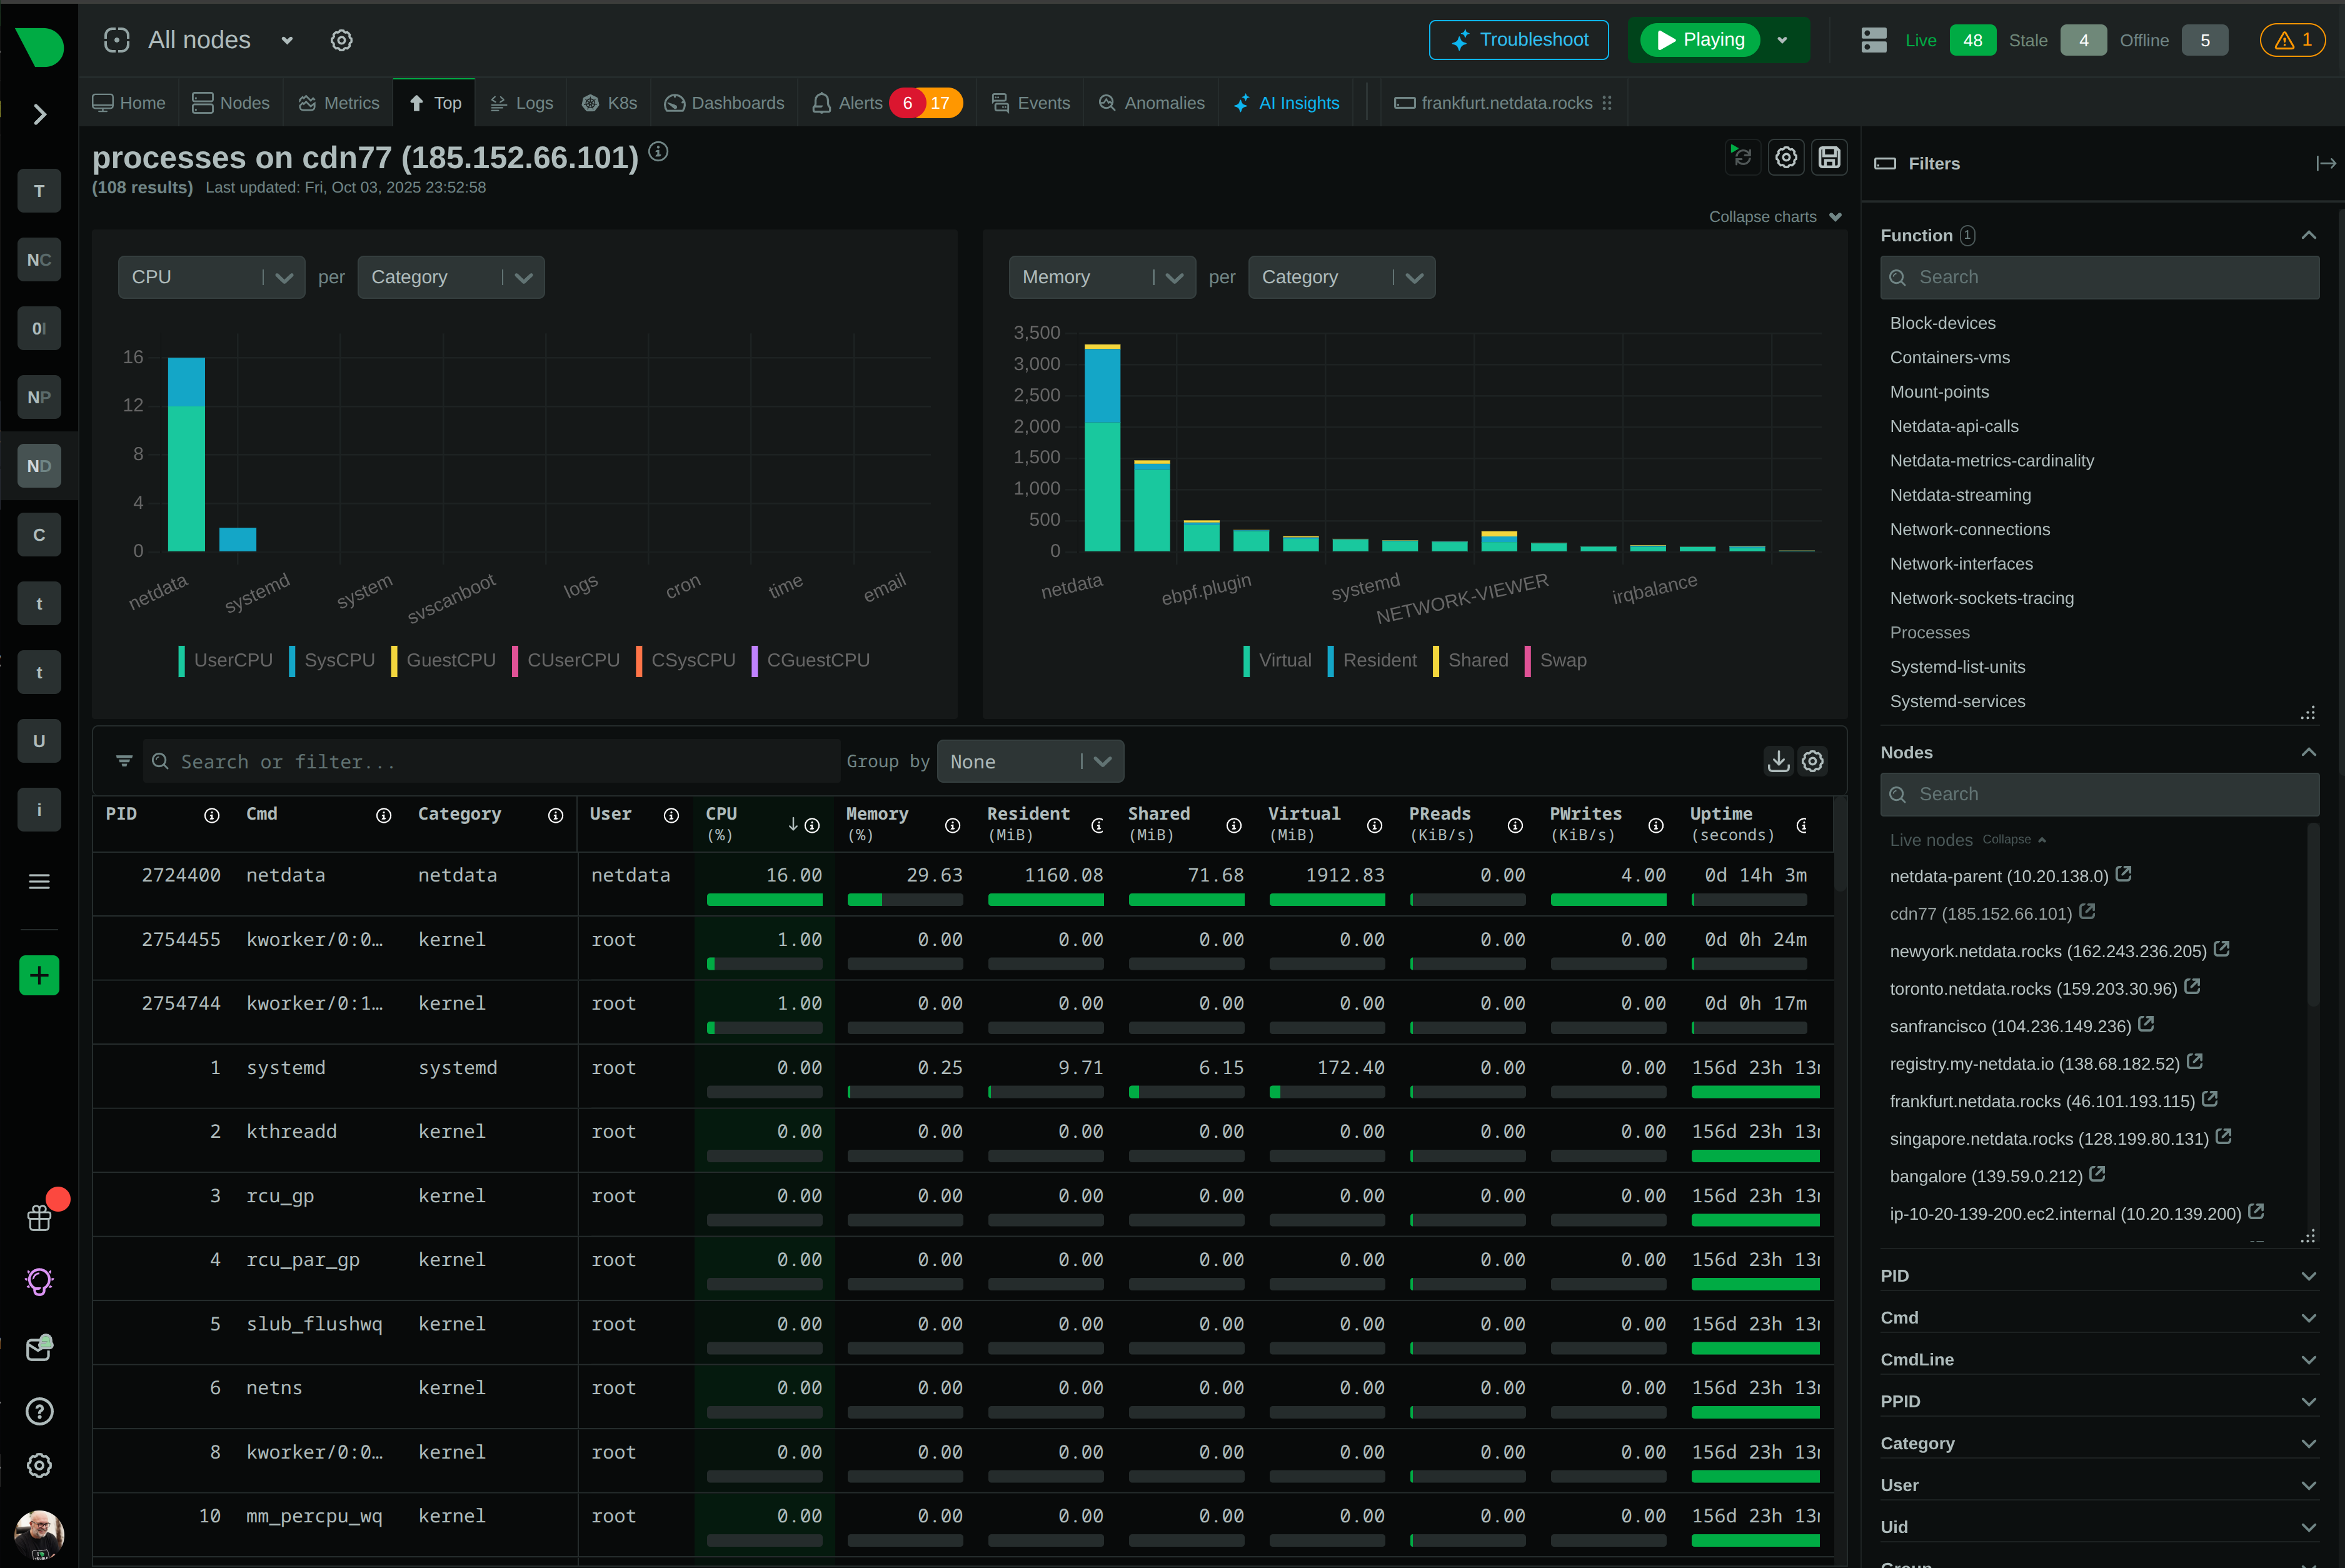
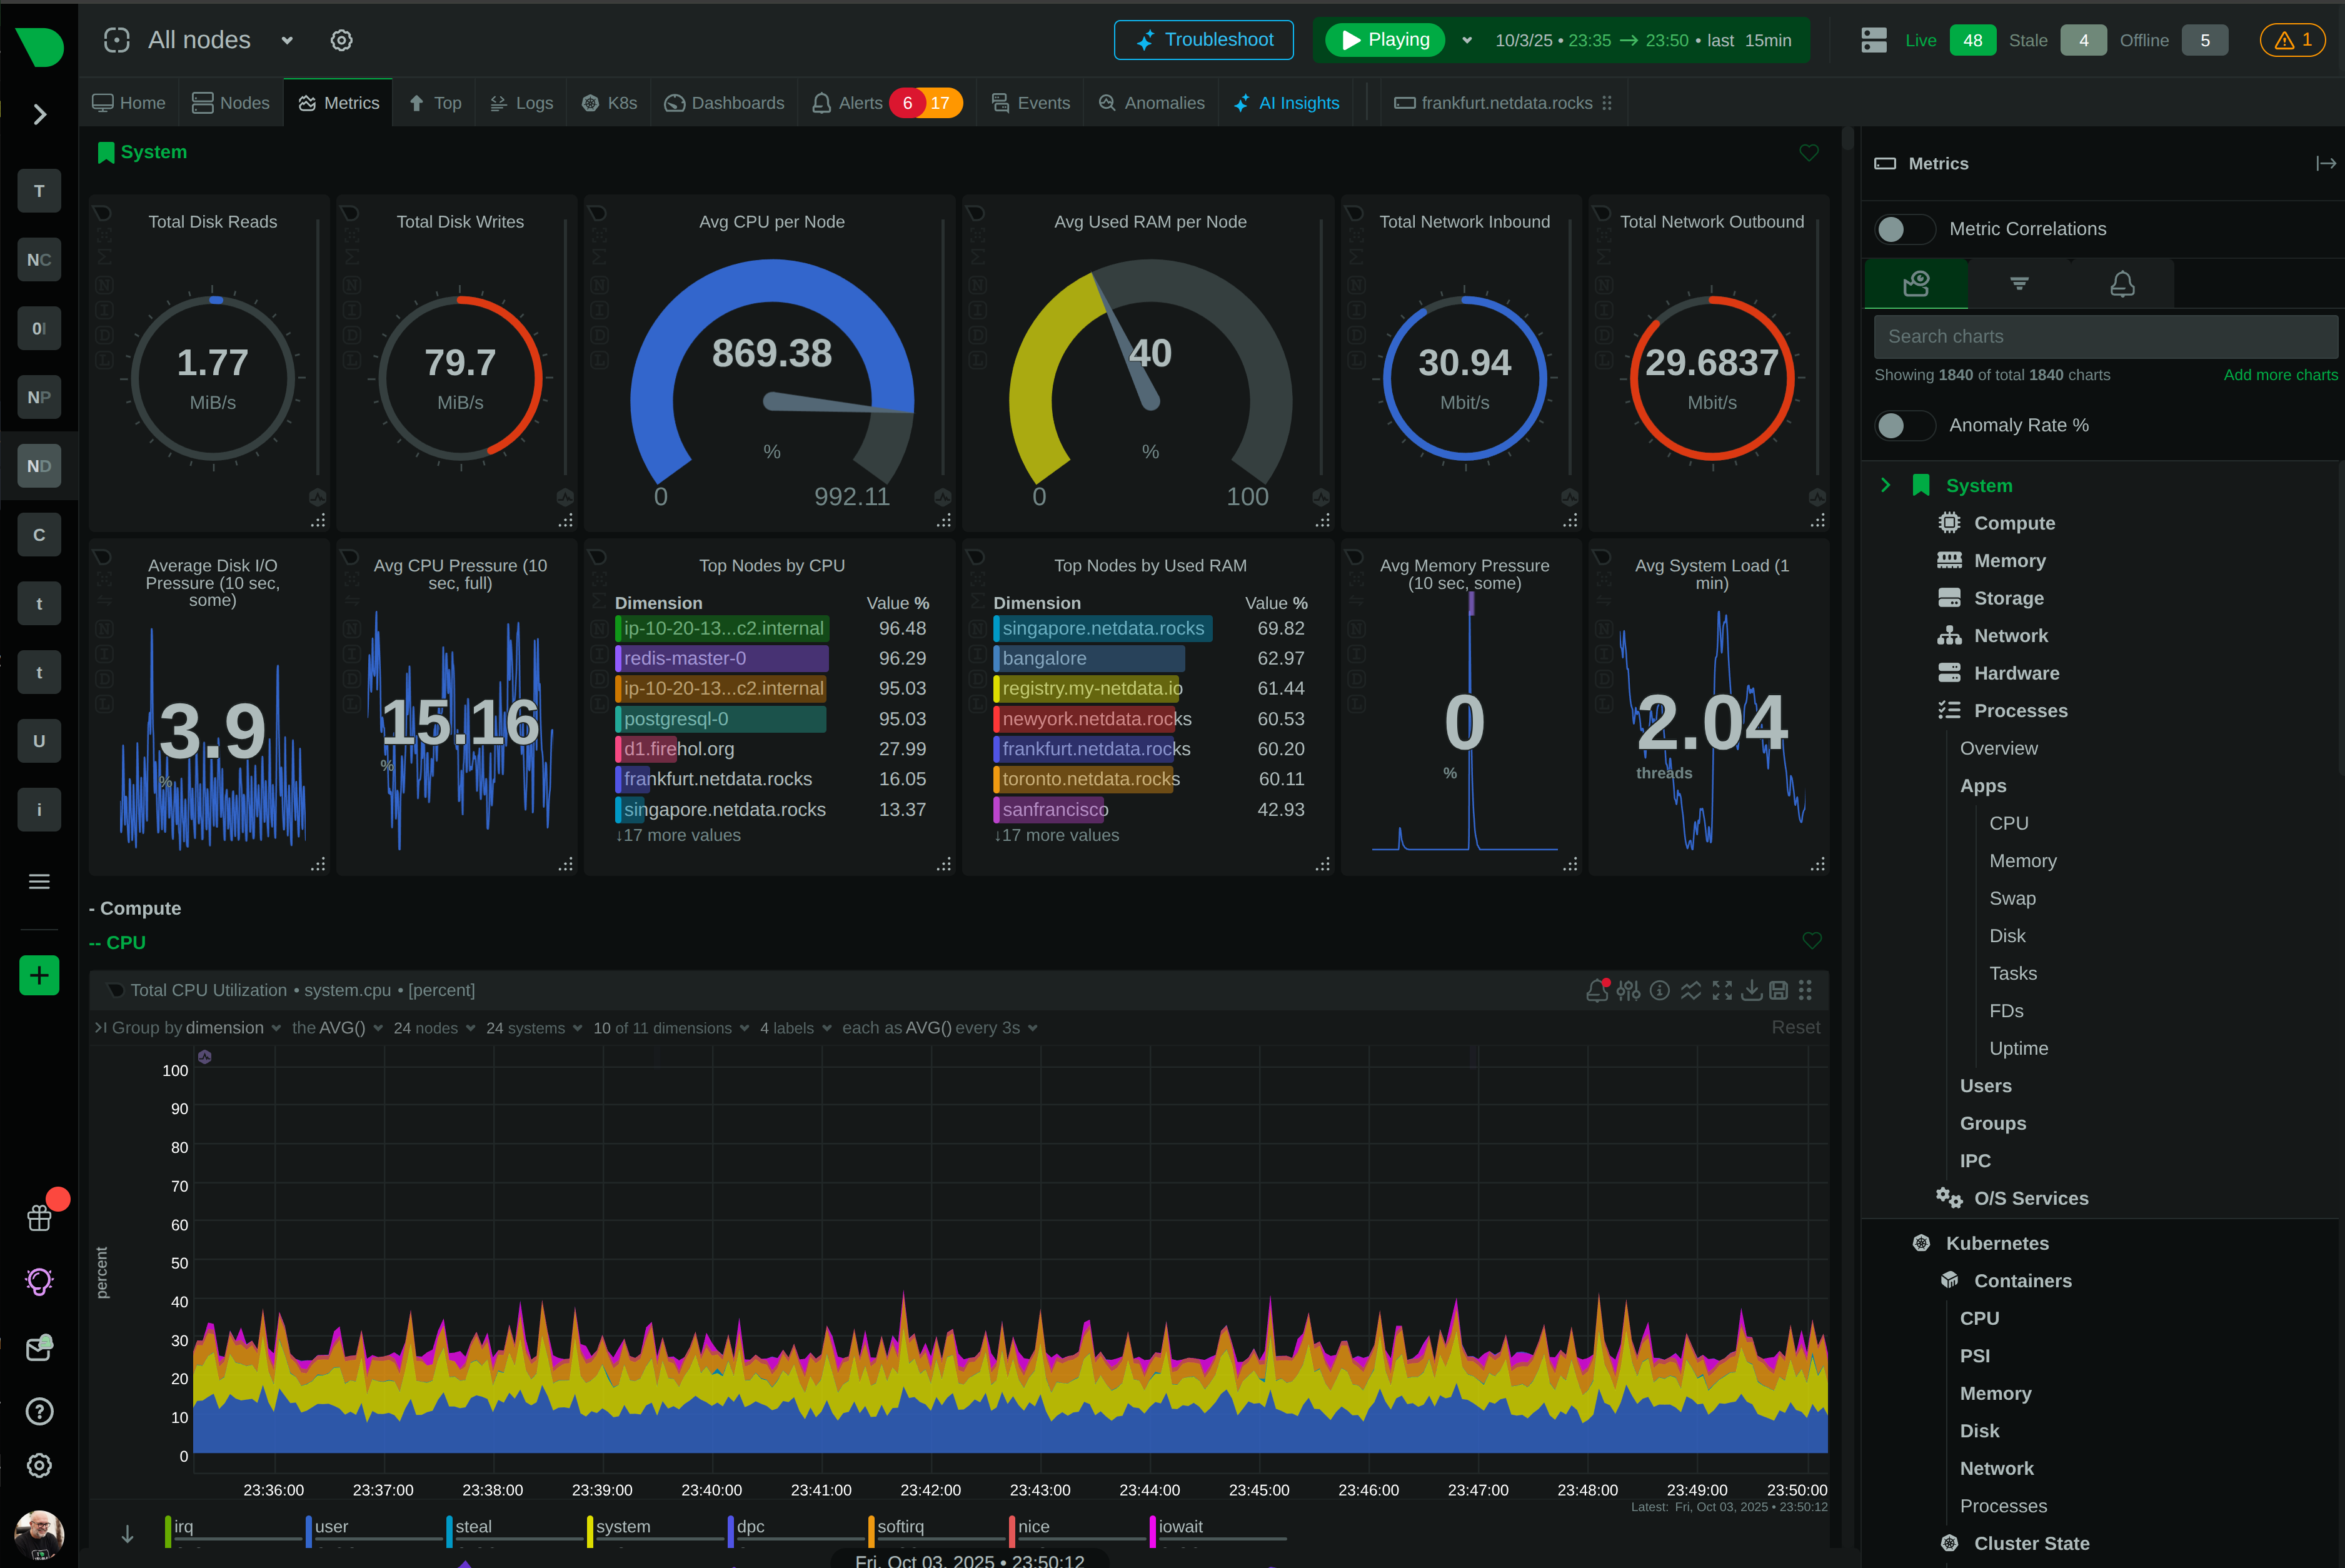
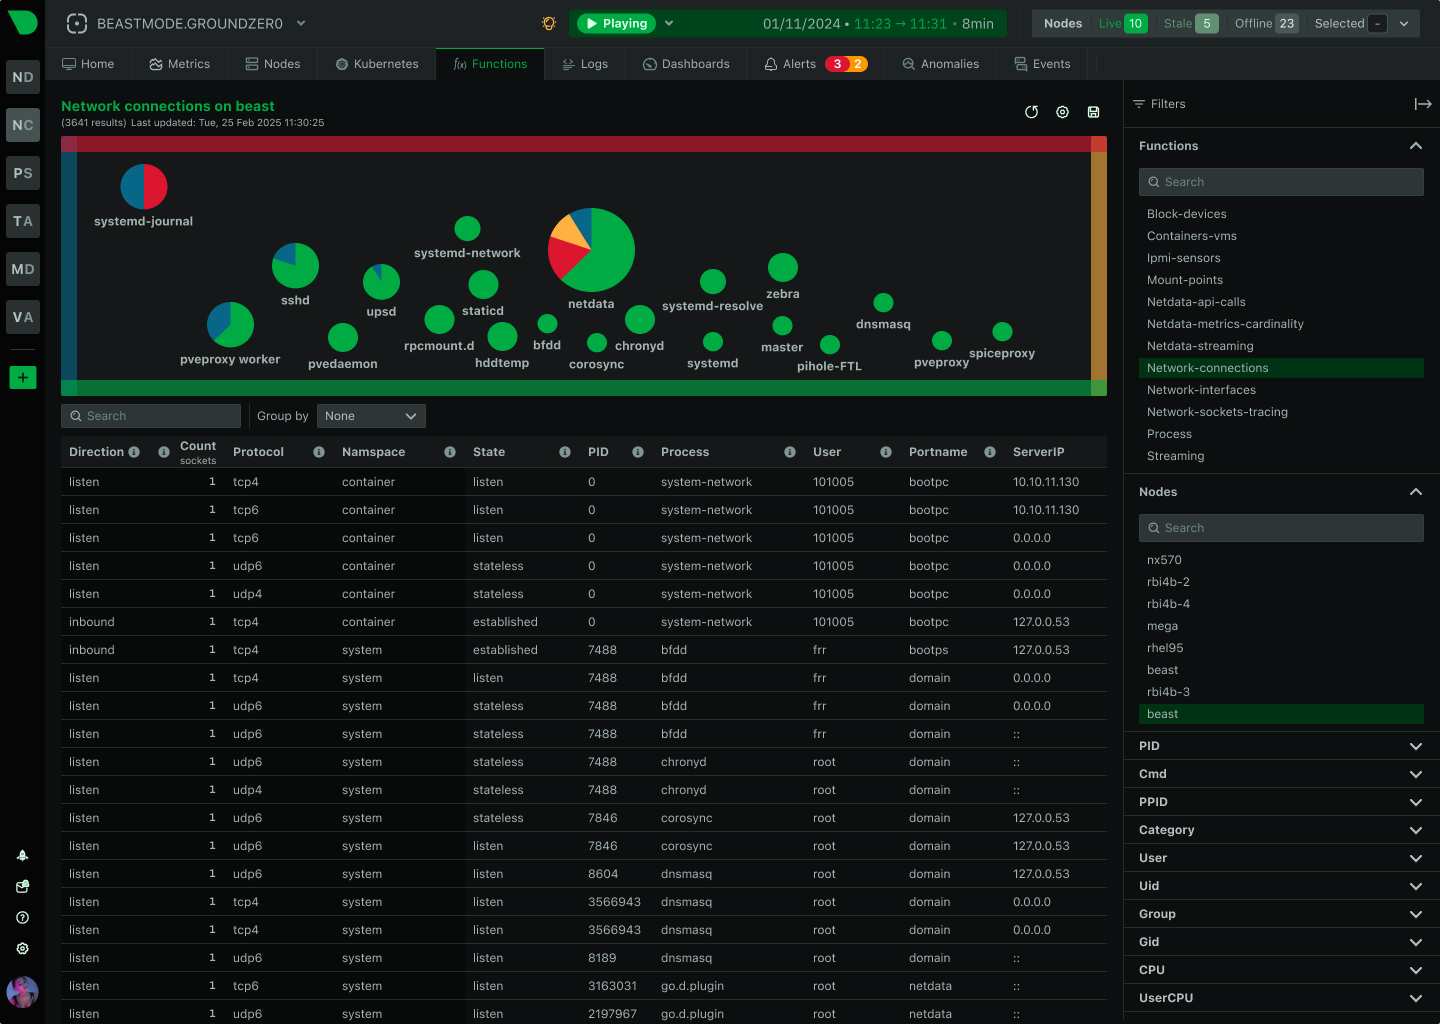
Metrics, logs, processes, connections - all in one interface. No context switching between fragmented tools.
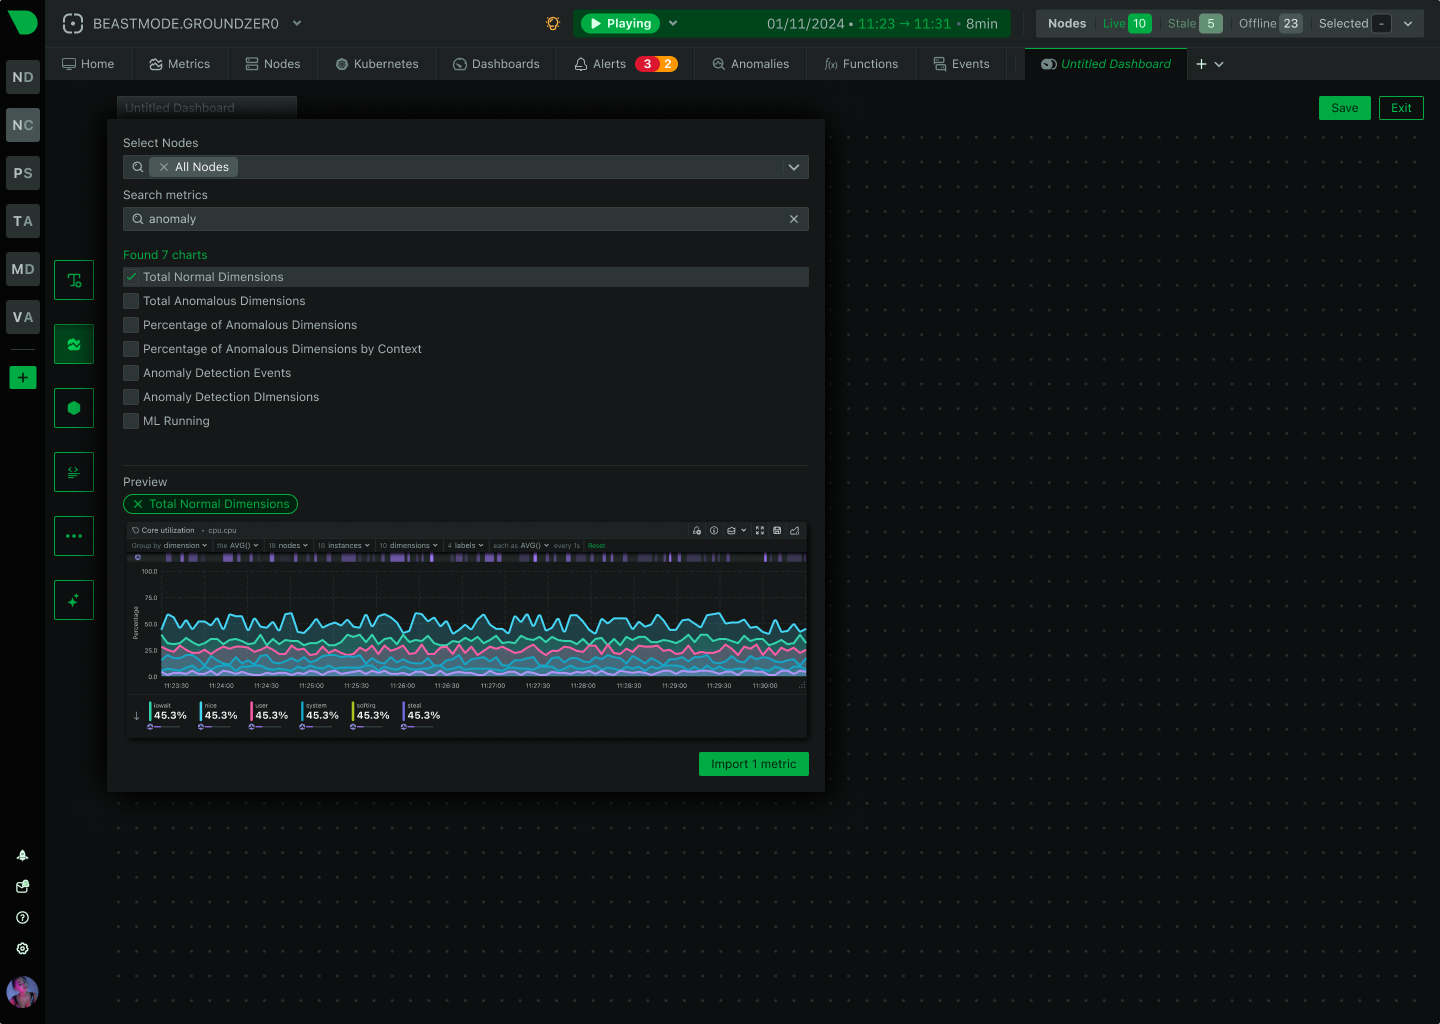
800+ integrations auto-discovered. Algorithmic dashboards. No PromQL, no manual building, no query languages required.
Per-node pricing with no hidden costs. Unlimited metrics, logs, users. 90% cost reduction vs commercial solutions.
Trusted by DevOps teams worldwide
60 seconds to first dashboard vs days/weeks for LGTM stack
See Quick Start Guide
10-30× more granular than standard monitoring
Learn About Real-Time
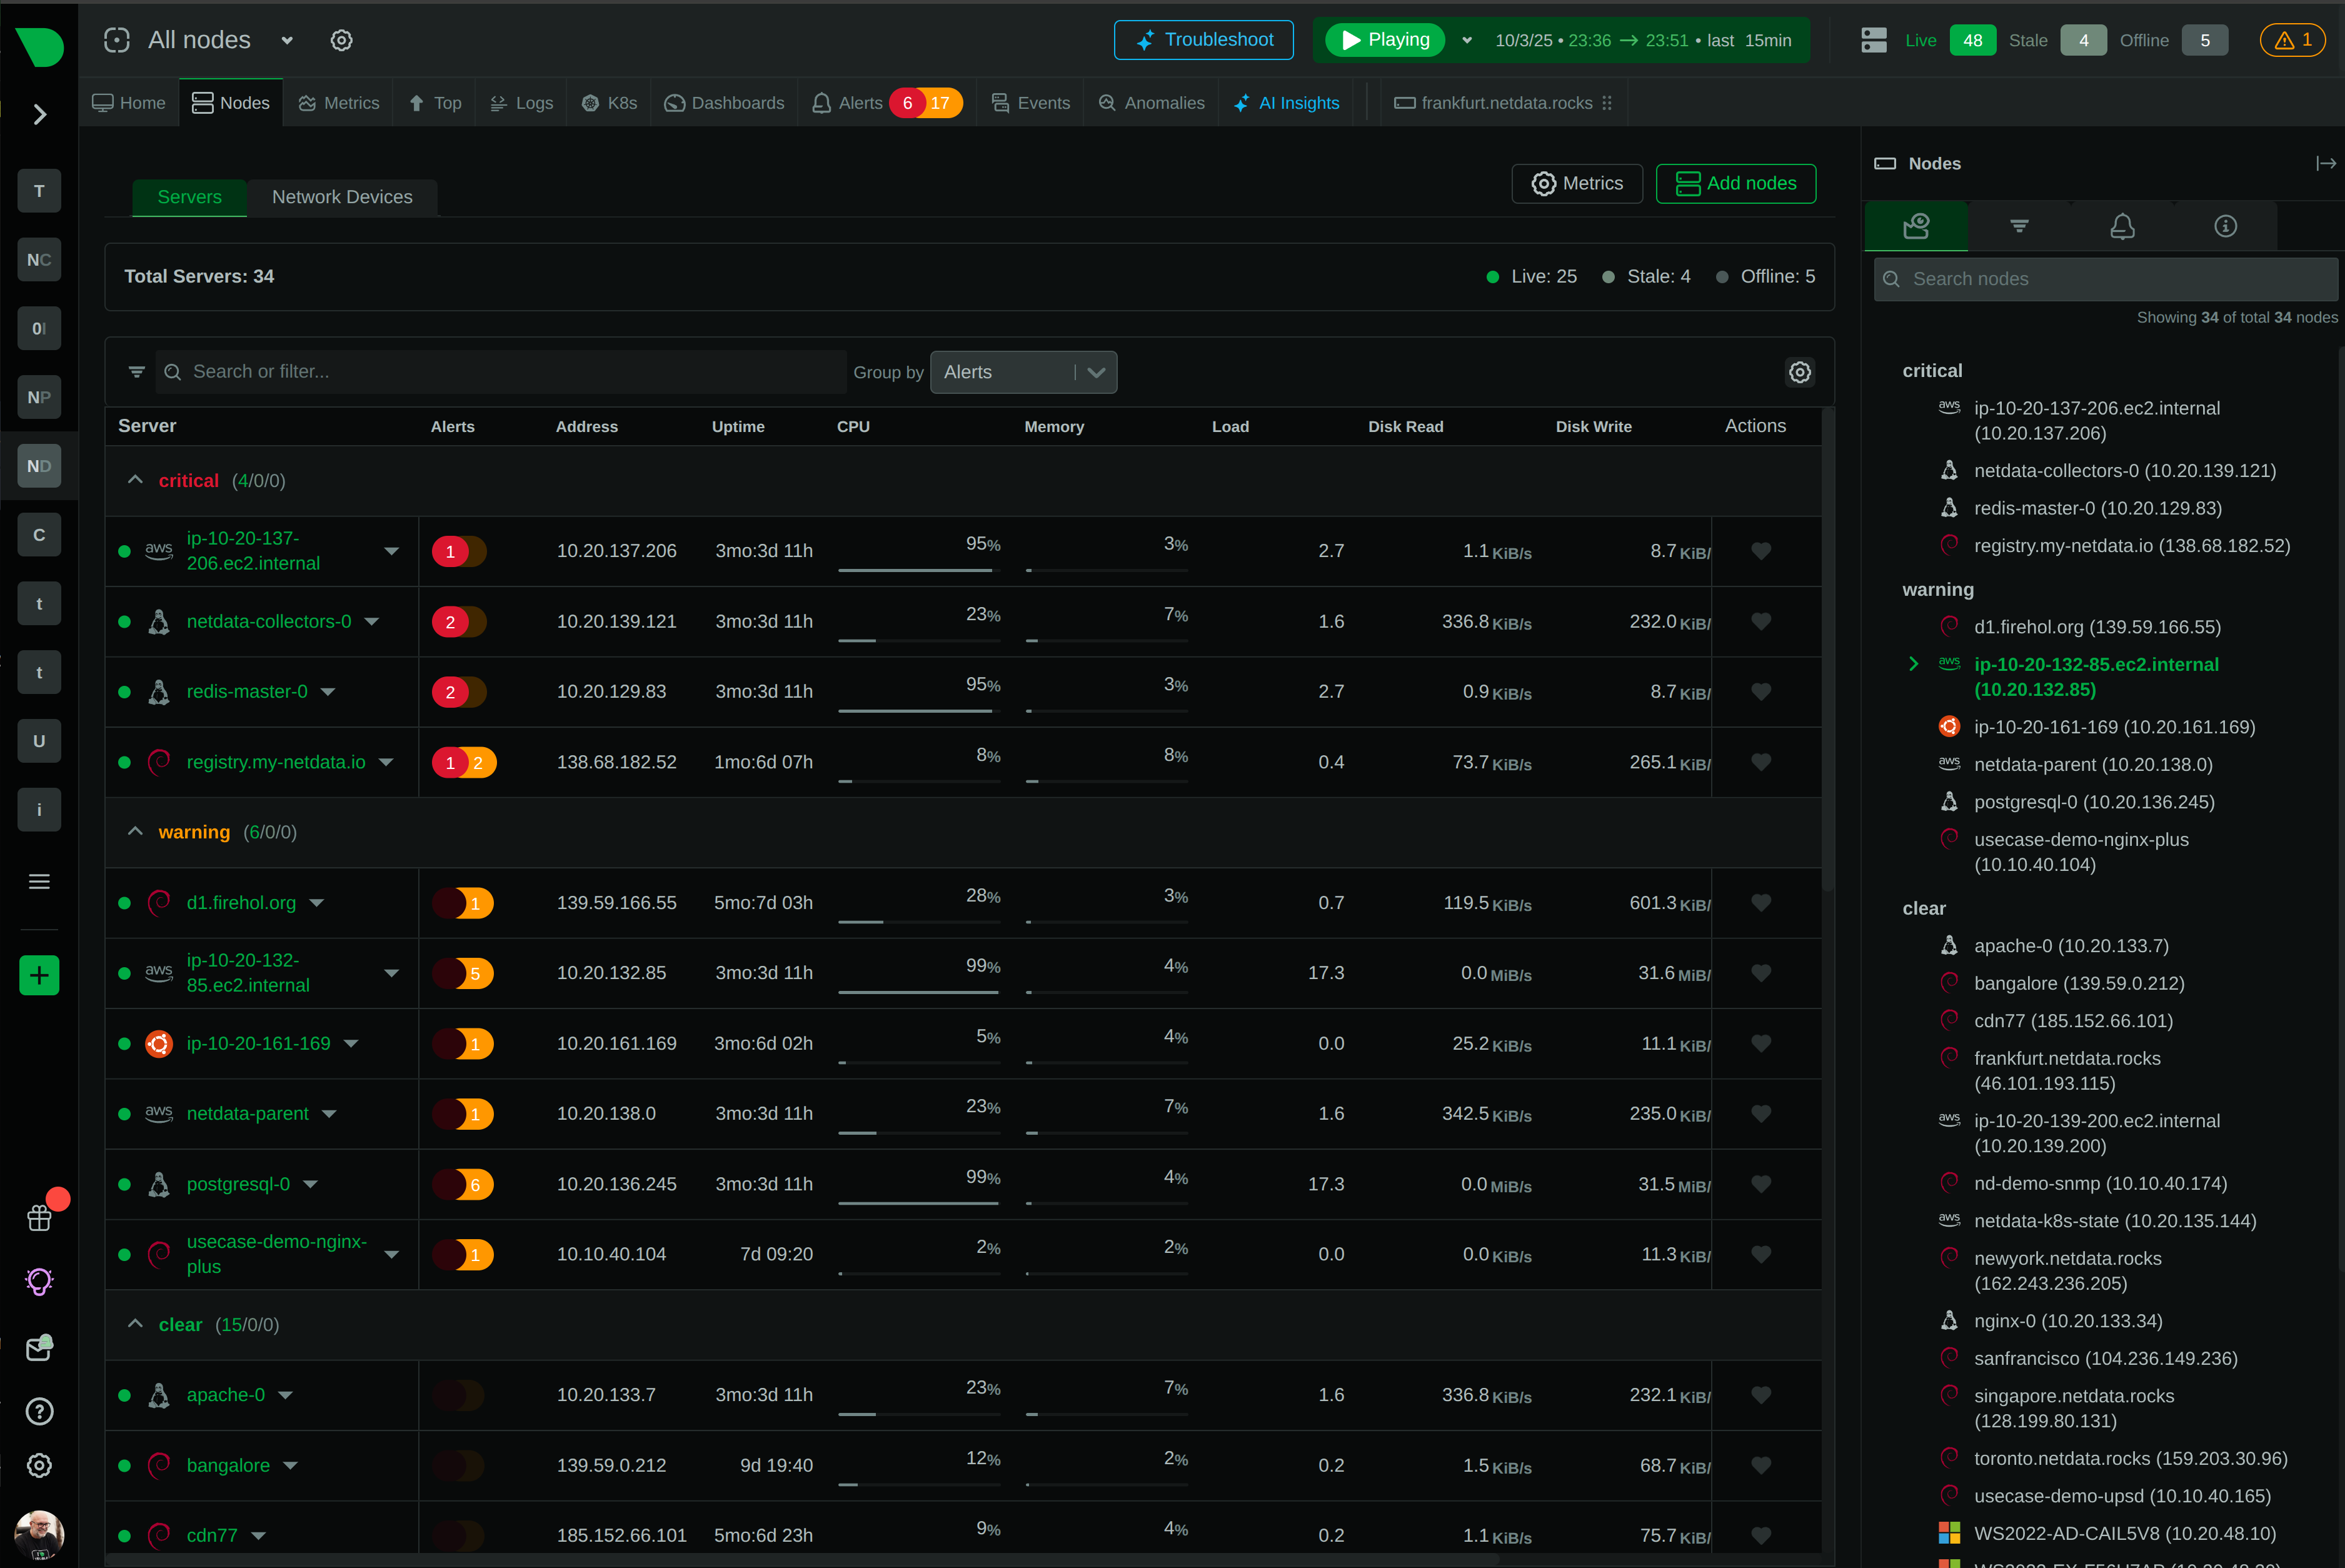
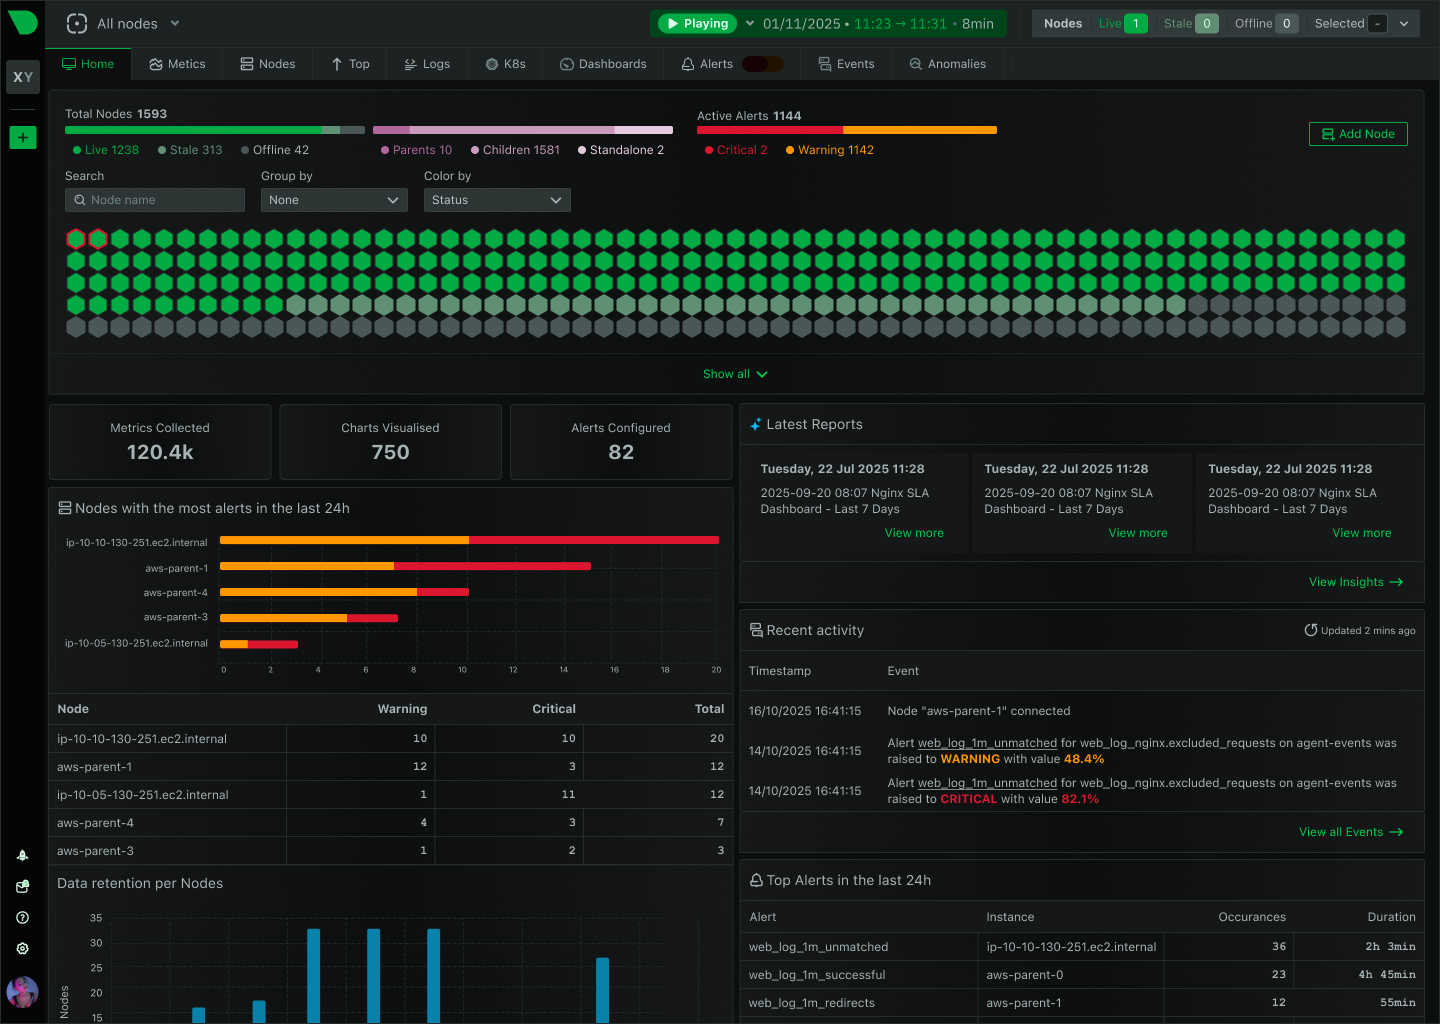
80% MTTR reduction through unified visibility
Explore AI Features
100,000+ node deployments in production
Understand Scalability

Replaces 20+ console tools with unified interface
See Netdata Functions
90% cost reduction vs Datadog/New Relic
View Pricing

Open Source Observability Comparison
See why millions choose Netdata over fragmented open source solutions
Capability
Netdata
Prometheus + Grafana + ELK
Time to First Dashboard
✅ 60 seconds
One-line install, instant visibility
⚠️ Days to weeks
Manual configuration, dashboard building
Data Granularity
✅ Per-second
True real-time, no sampling
⚠️ 10-30 seconds
Near real-time, misses transients
Configuration Required
✅ Zero
Auto-discovery, algorithmic dashboards
❌ Extensive
Collectors, exporters, dashboards
Query Language
✅ None
Point-and-click analysis
❌ PromQL + LogQL
Steep learning curve
ML Anomaly Detection
✅ Automatic
18 models per metric, edge-based
❌ Manual
Requires configuration and tuning
Unified Platform
✅ Metrics + Logs
Single interface, instant correlation
❌ Fragmented
3+ tools, context switching
Operational Overhead
✅ Zero
Self-managing, no maintenance
❌ Dedicated FTE
Constant tuning and scaling
Storage Efficiency
✅ 0.6 bytes/sample
Industry-leading compression
⚠️ 2-16 bytes/sample
Higher storage costs
AI Troubleshooting
✅ Included
Natural language via MCP
❌ Not Available
Manual investigation only
76,300+ GitHub stars. 615+ contributors. 1.5M downloads per day. Active Discord community. Transparent development. Your voice shapes the roadmap.
Join millions of engineers worldwide
View on GitHub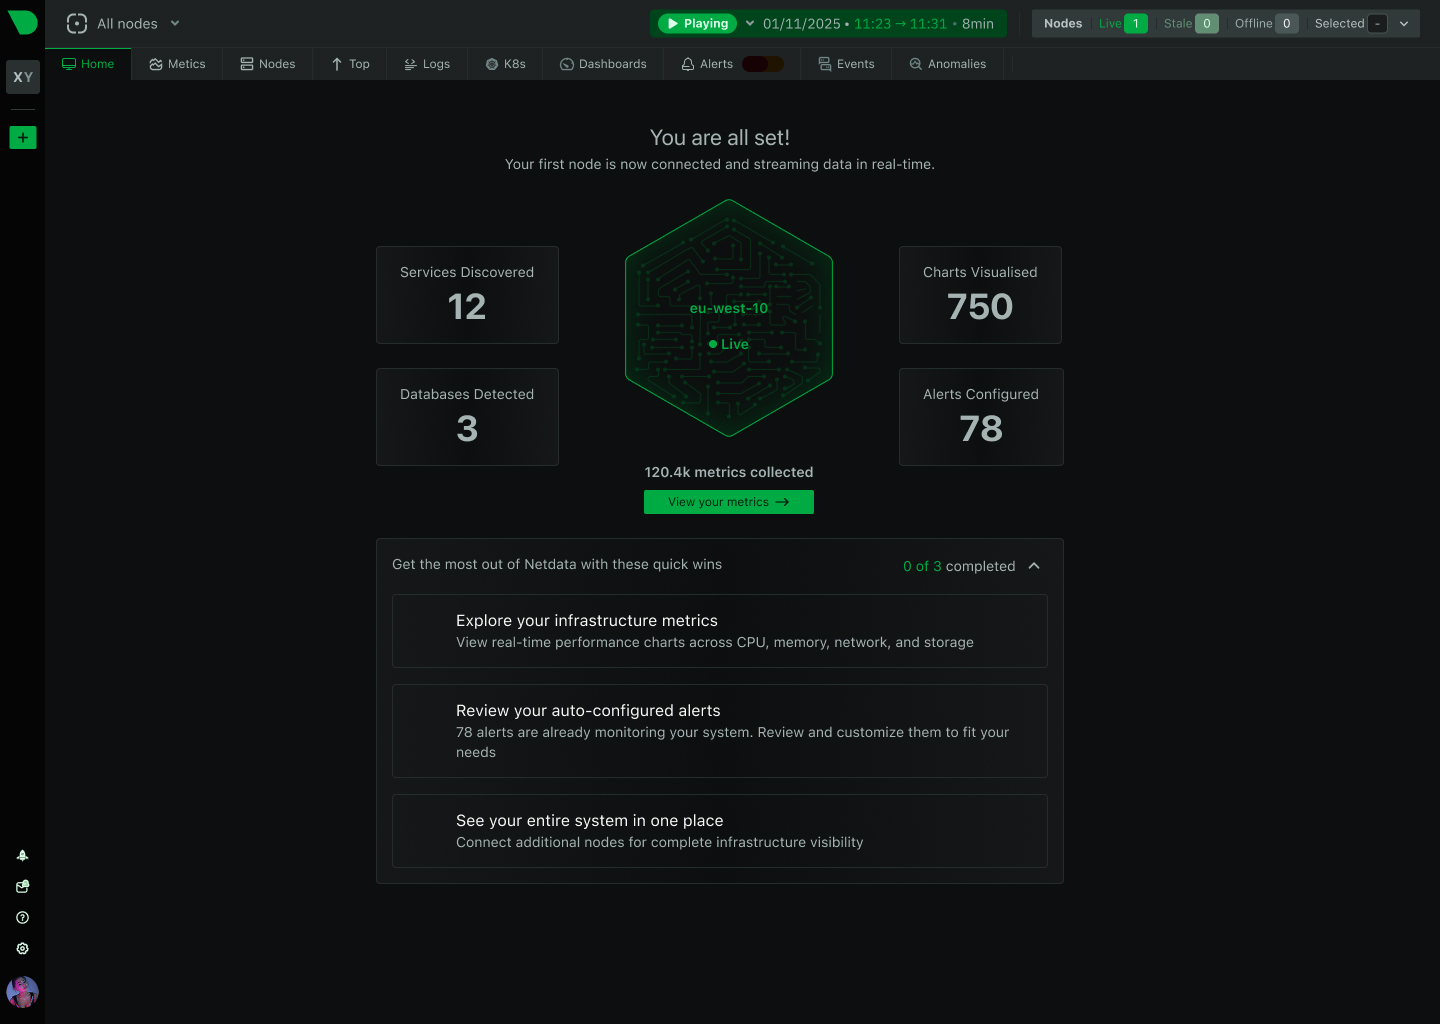
The benefits that matter most to engineering teams
One-line install. Auto-discovery. Instant dashboards. From installation to insights before your coffee gets cold.
Junior engineers get senior-level visibility automatically. No query language expertise required. Same powerful tools for everyone.
Transparent per-node pricing. Unlimited metrics, logs, users. No surprise bills based on data volume.
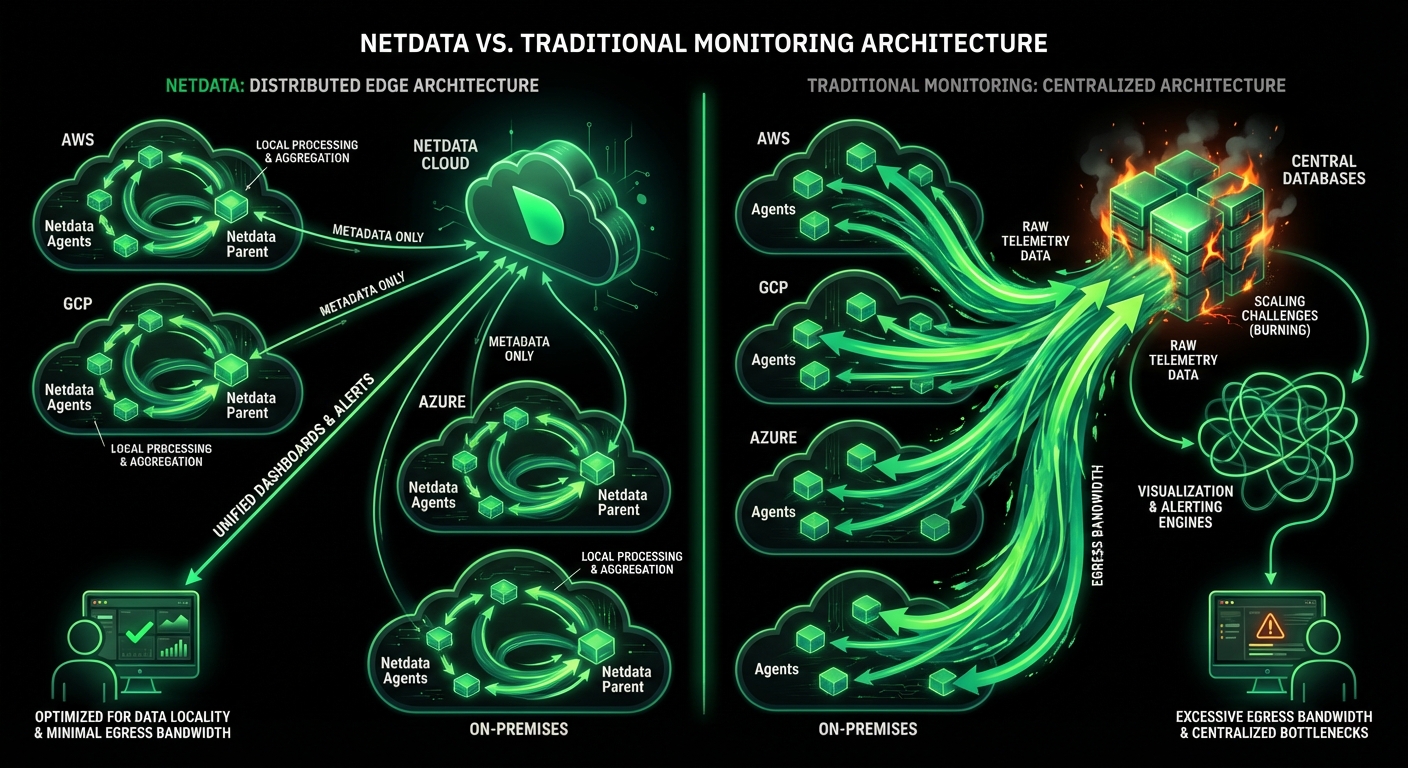
All metrics stay on-premises. Only metadata travels to Cloud. GDPR, HIPAA, PCI DSS aligned by design.
Per-second data collection with 1-second visualization latency. See what’s happening now, not 30 seconds ago.
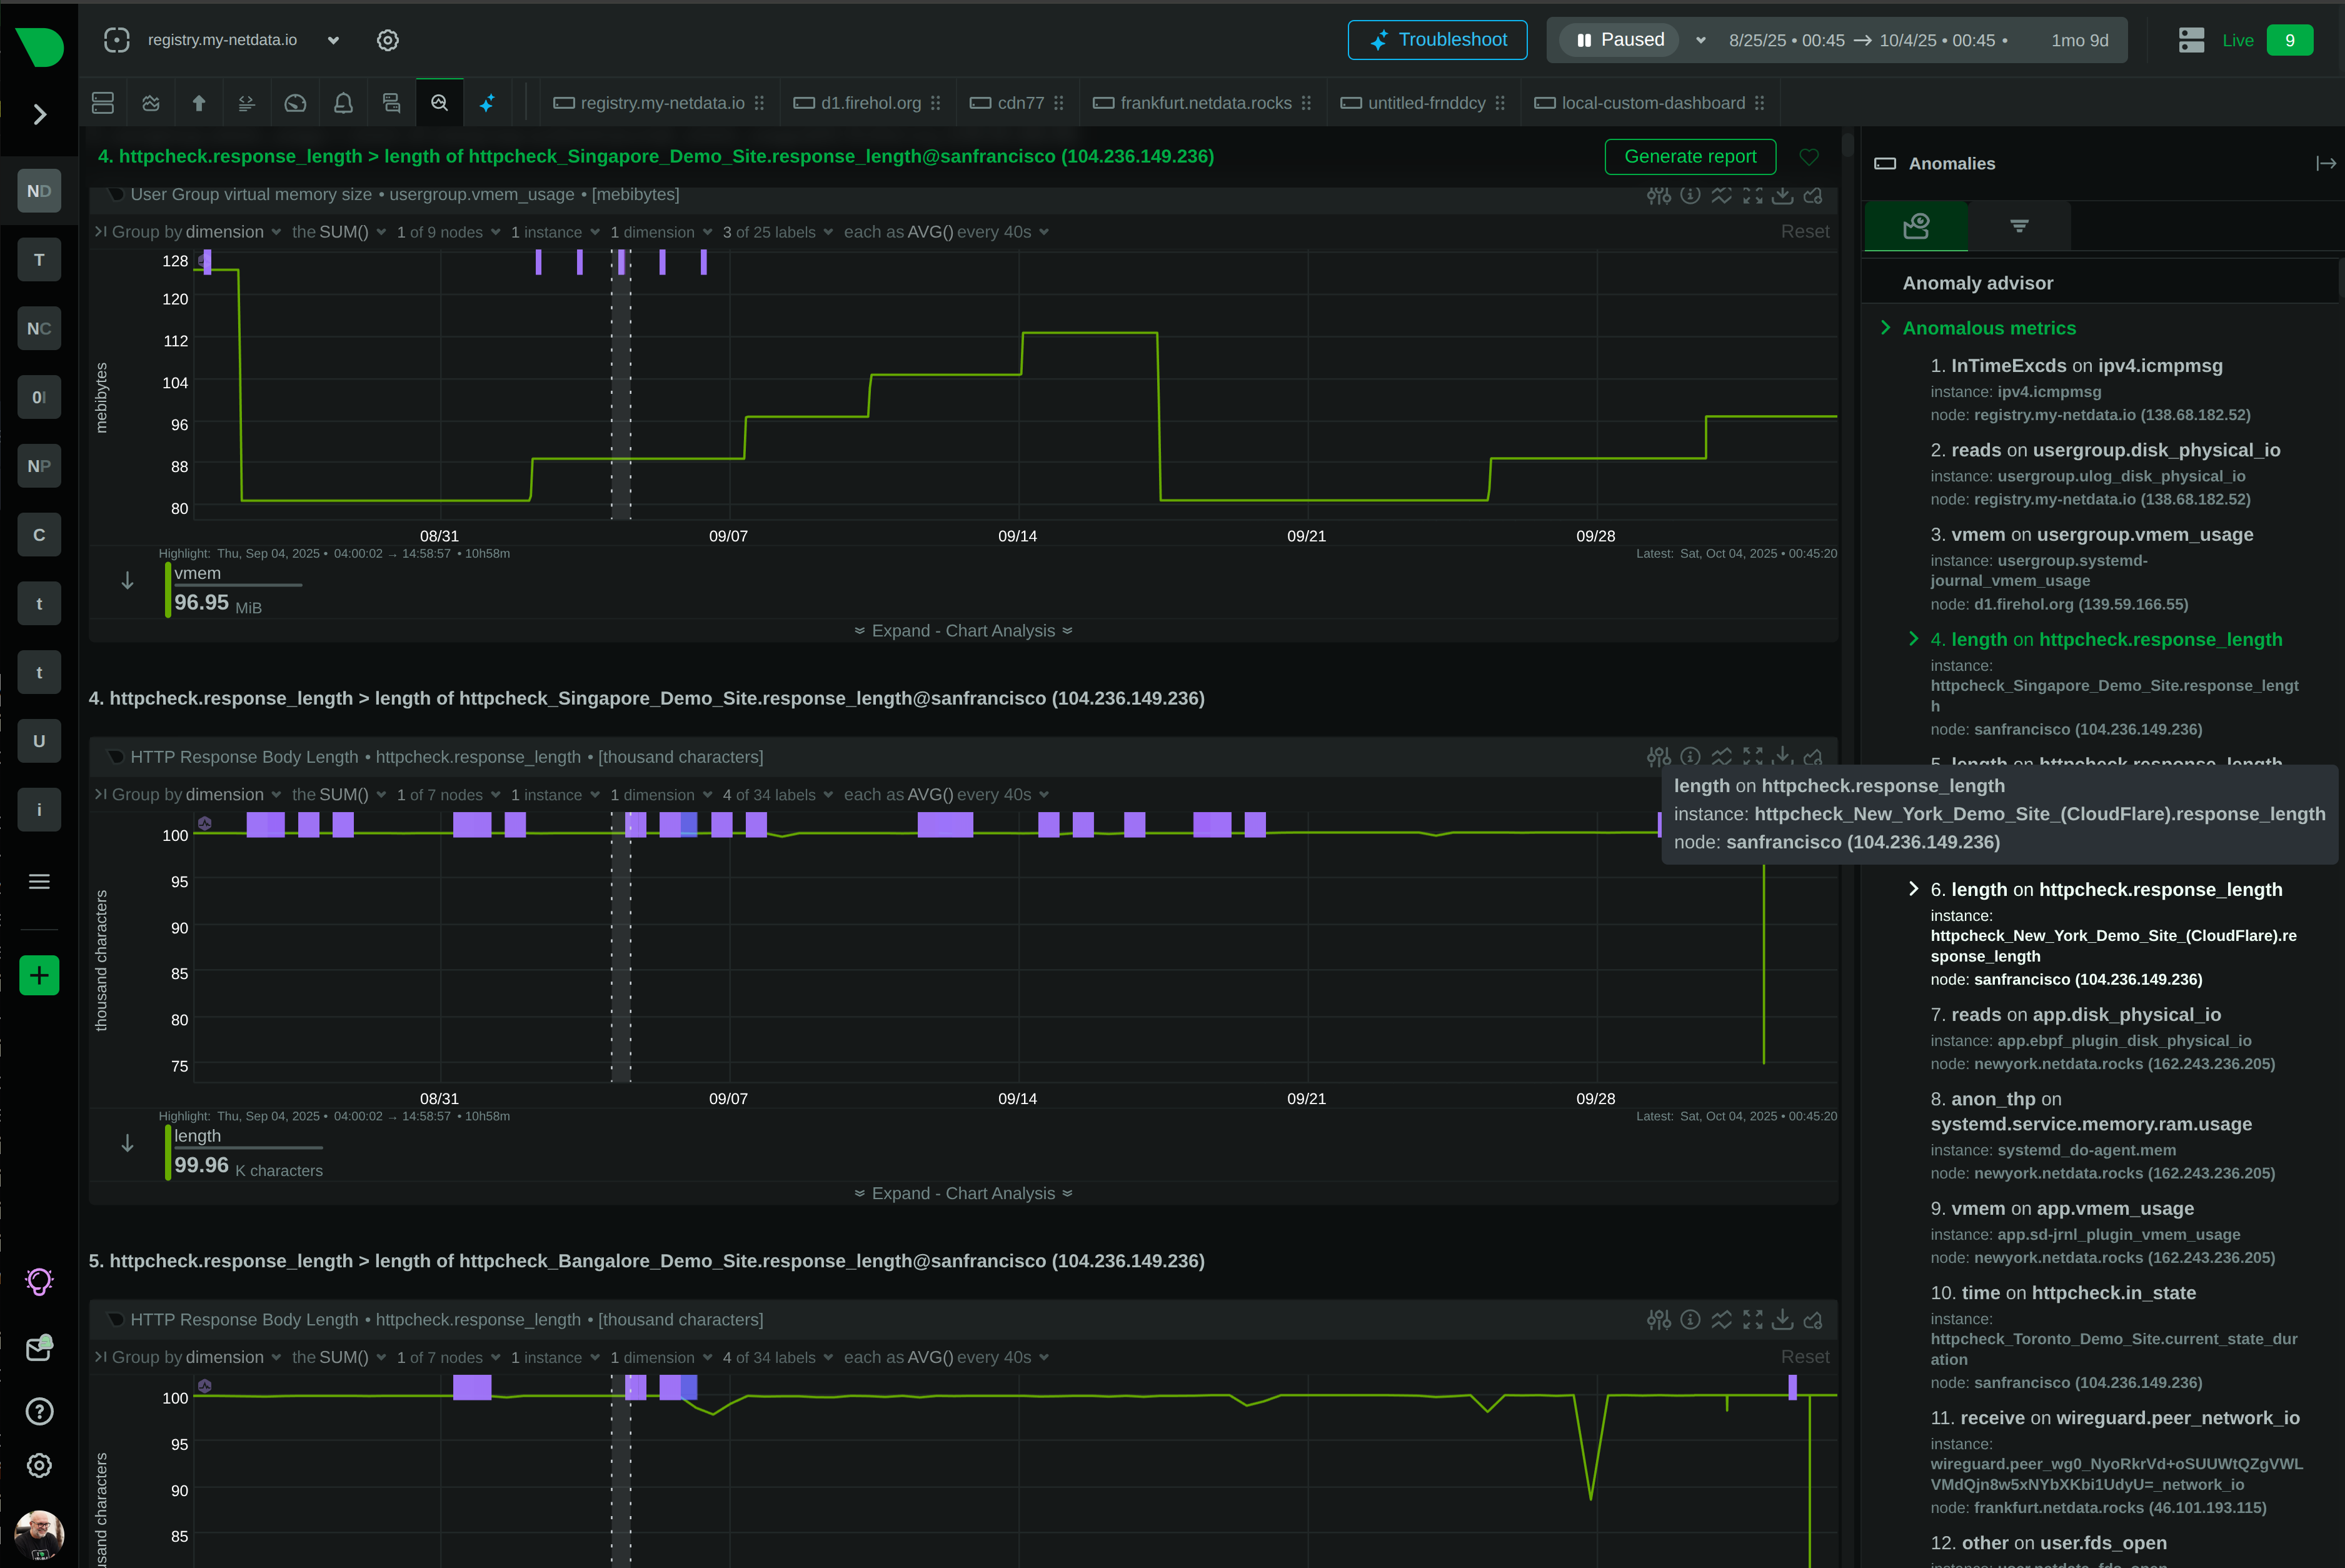
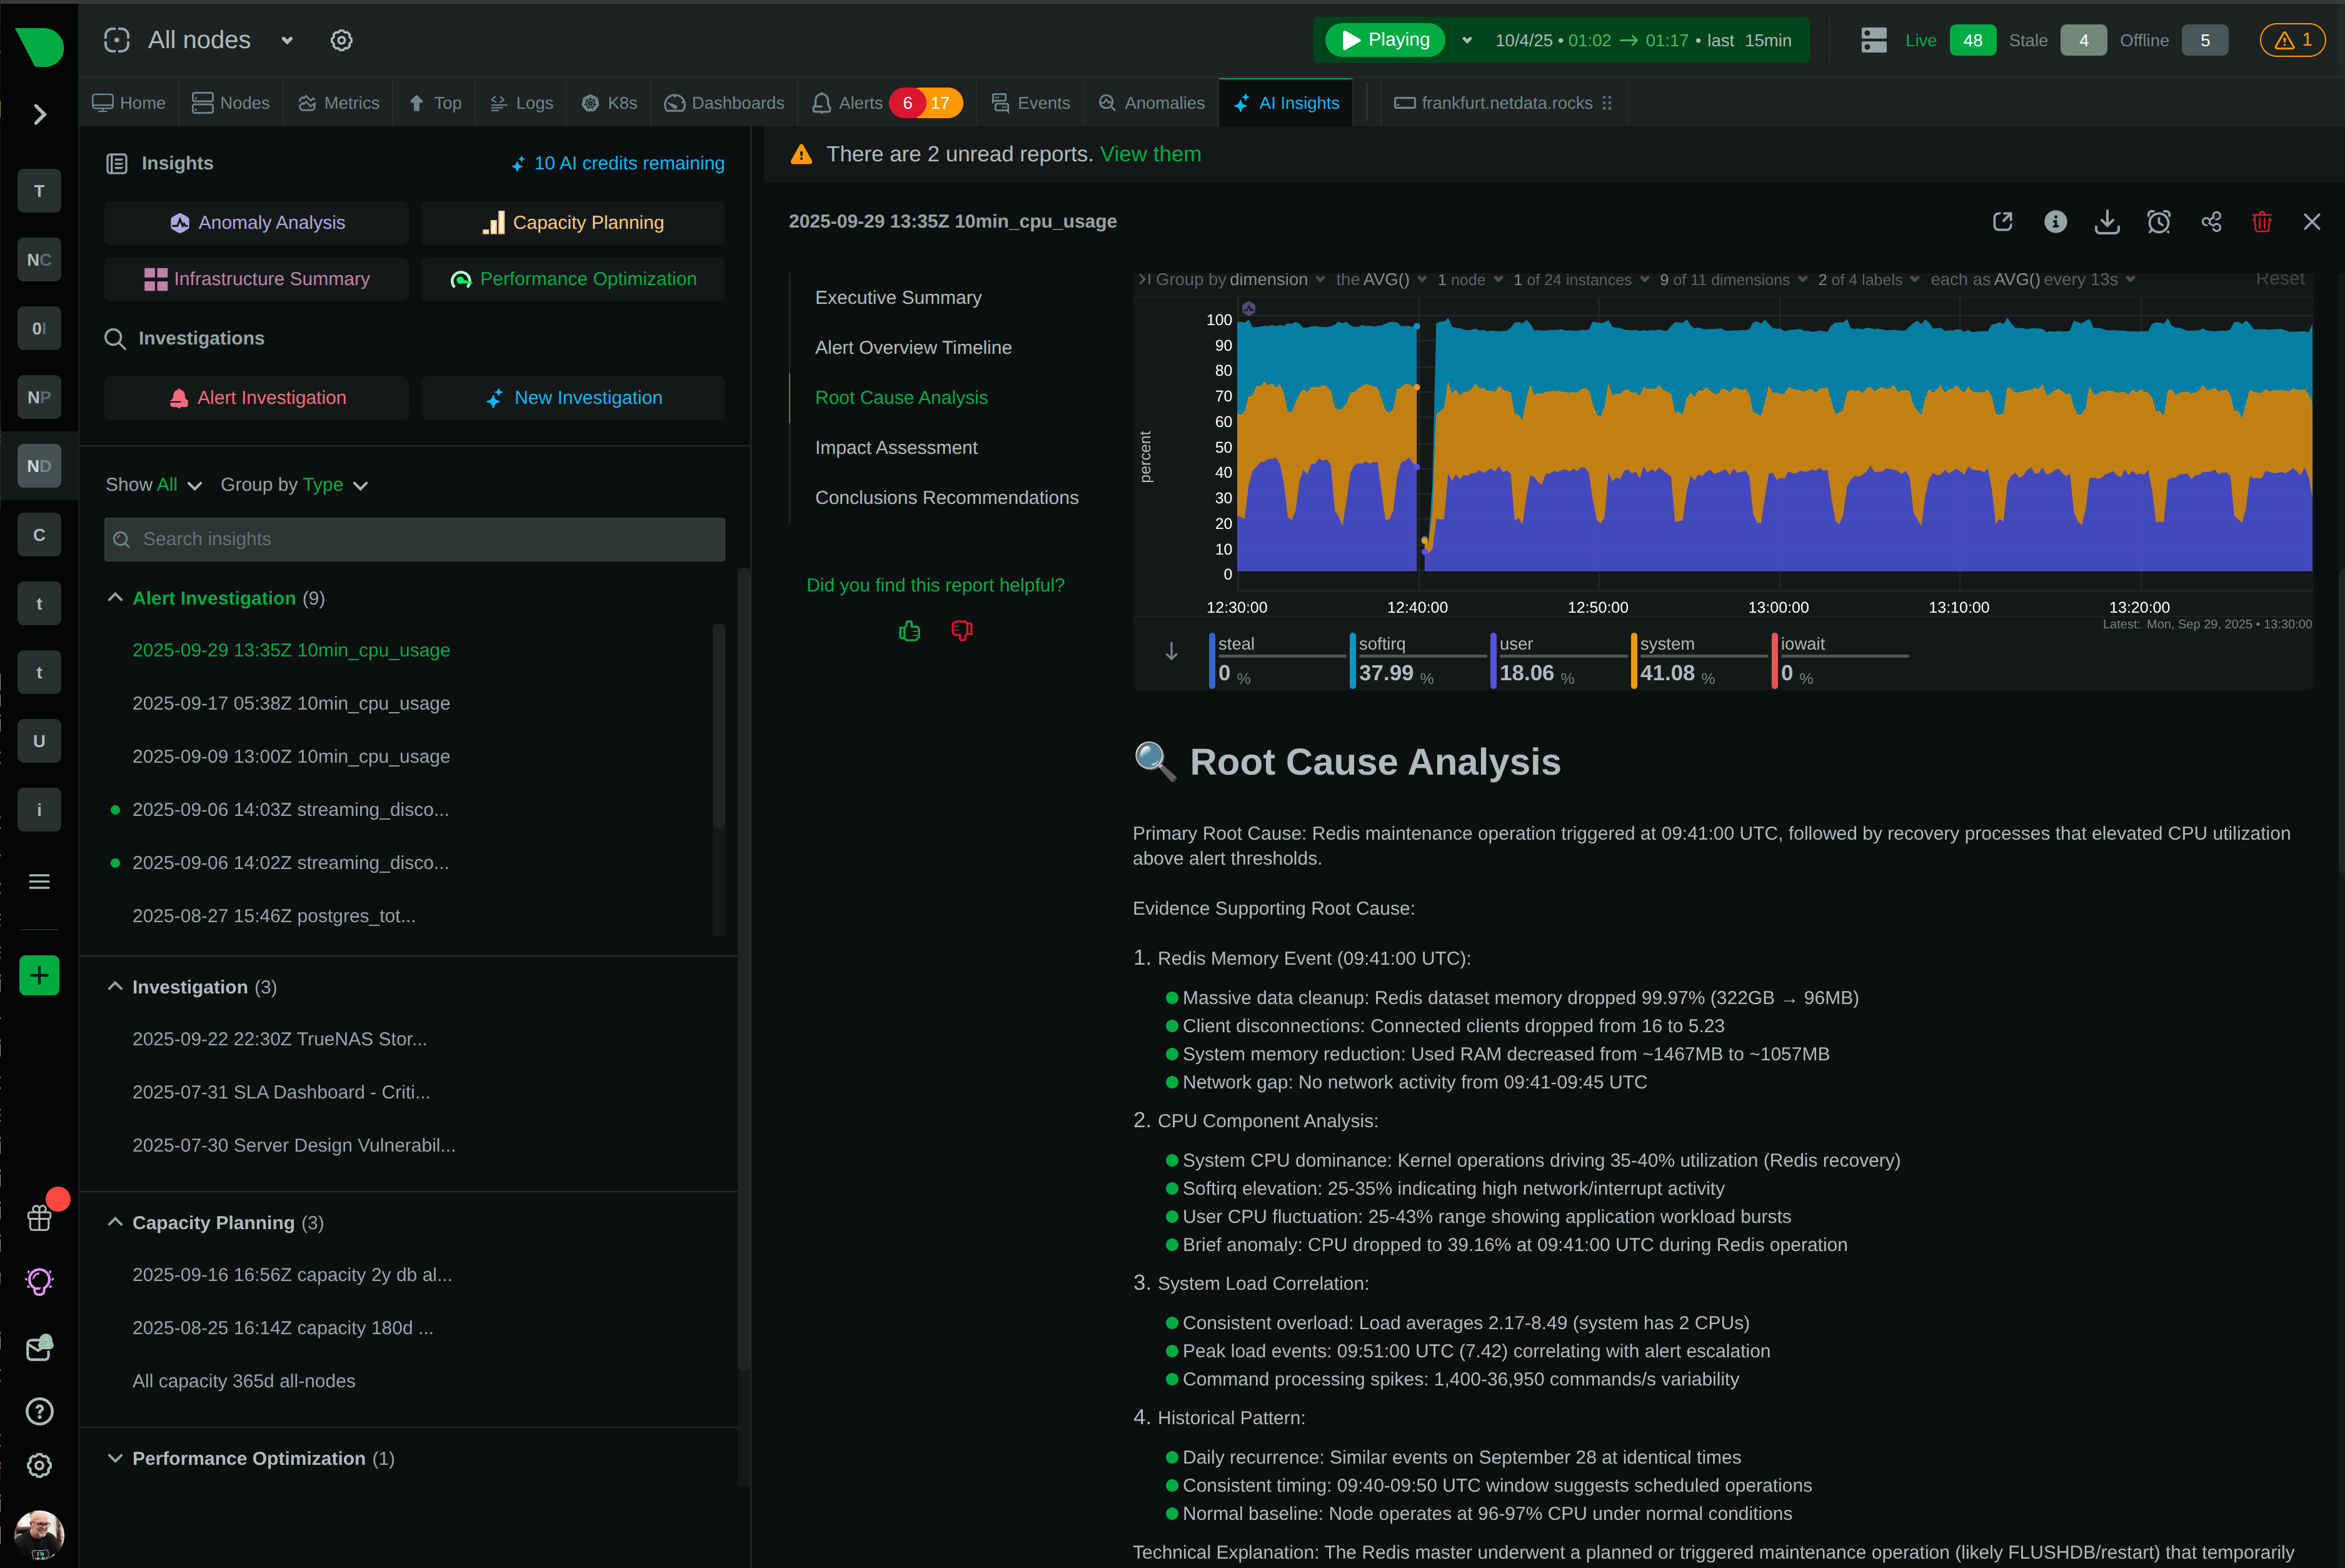
18 unsupervised models train automatically. 99% false positive reduction in anomaly detection. Root cause in top 30-50 results.
Metrics, logs, processes, connections - all in one interface. No context switching between fragmented tools.
Grow from 10 to 10,000 nodes without changing architecture. Proven at 100,000+ node deployments.
Natural language queries via Model Context Protocol. Bring your own LLM. Root cause analysis in seconds.

April 2, 2026
Netdata AI now lets you start a conversation about any chart, alert, or Insights report directly from where you're already working. Ask questions, get explanations, and kick off deep-dive investigations without switching context.

February 27, 2026
Connect AI coding agents like Claude Code, Codex, and Cursor to your entire infrastructure with a single endpoint. The Netdata Cloud MCP Server brings infrastructure-wide observability to any MCP-compatible AI tool.

February 3, 2026
Join Netdata at the Howard Conference and Expo 'Game On' event, February 24-26, 2026 in Fairhope, Alabama. Learn how real-time, high-fidelity monitoring helps you stay ahead of infrastructure challenges.