

Transform Every Question Into Instant Insight
Eliminate dashboard toil with algorithmic dashboards that adapt to your infrastructure automatically. Get custom-level precision without configuration effort - dashboards as soon as data is collected.

Eliminate dashboard toil with algorithmic dashboards that adapt to your infrastructure automatically. Get custom-level precision without configuration effort - dashboards as soon as data is collected.

The power of custom dashboards without the complexity
Production-ready dashboards as soon as data is collected. No query languages, no manual building, no configuration burden - just immediate visibility across your entire infrastructure.
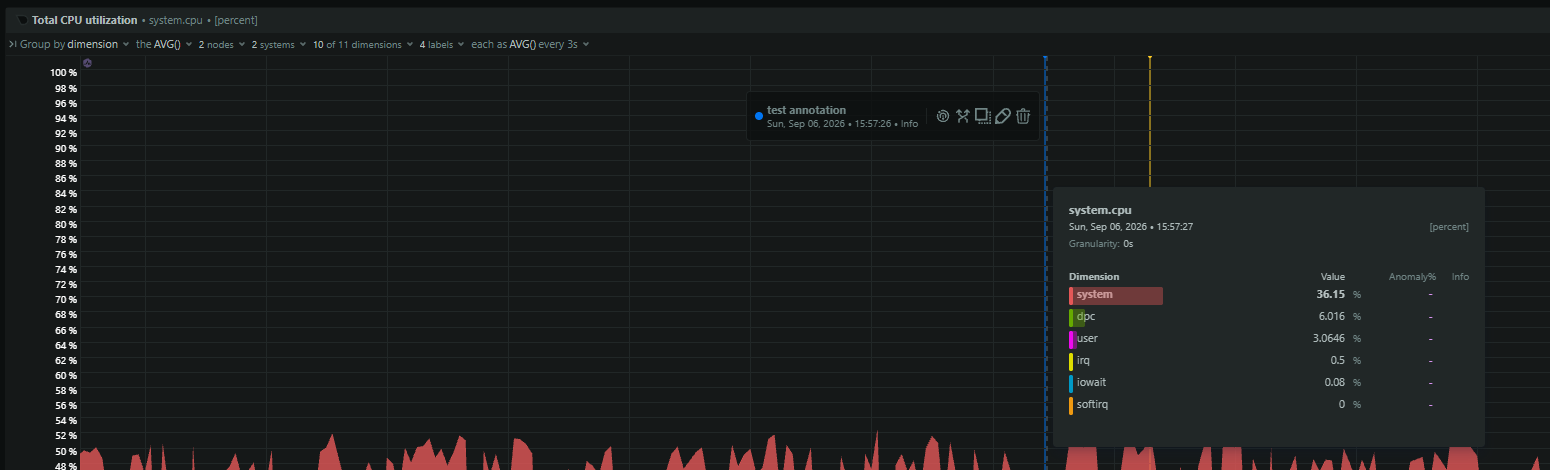
Each chart is a complete analytical tool equivalent to 25+ Grafana charts. Slice, dice, group, and filter any dataset with simple point-and-click interactions.
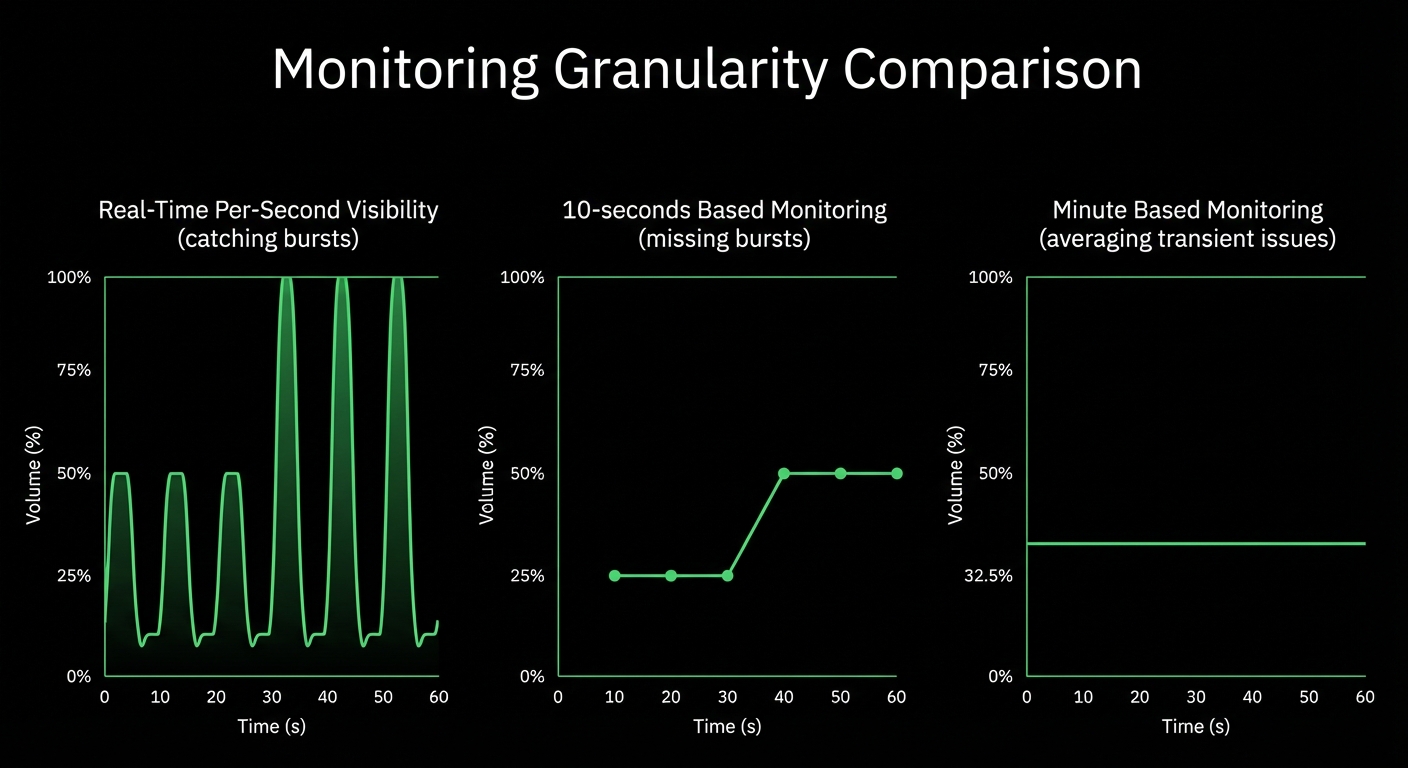
Per-second data collection with sub-2-second latency. See what’s happening right now - catch microbursts and transient issues invisible to minute-based monitoring.
Anomaly detection on every metric automatically. Anomaly Advisor surfaces root cause in top 30-50 results. AI troubleshooting explains issues in plain language.
Dashboards adapt automatically as infrastructure changes. New containers appear instantly, deleted resources vanish cleanly - no dashboard sprawl, no manual updates.
Monitor everything, every second, without surprise bills. Simple per-node pricing with no per-metric charges and no per-dashboard fees.
Trusted by DevOps teams worldwide
80% MTTR Reduction
See How It Works

One-Line Install, Dashboards From Day One
Explore NIDL Framework

Complete Tool Consolidation
See Live Monitoring

Linear Scalability
Learn About Architecture

Dashboard Approach Comparison
See how Netdata’s zero-configuration approach delivers custom-level precision without the complexity and maintenance burden of traditional dashboard solutions.
Capability
Netdata
Traditional Monitoring
Time to First Dashboard
✅ As soon as data is collected
Automatic generation from installation
⚠️ Weeks to months
Manual building and configuration required
Query Language Required
✅ None
Point-and-click NIDL framework
❌ PromQL/NRQL/SQL
Steep learning curve for queries
Data Granularity
✅ Per-second
Sub-2-second total latency
⚠️ 10-60 seconds
Misses transient issues and microbursts
Dashboard Maintenance
✅ Zero
Adapts automatically to infrastructure changes
❌ Continuous
Manual updates as systems evolve
Analytical Capability Per Chart
✅ 360° views
Equivalent to 25+ Grafana charts
⚠️ Single view
Multiple charts needed for analysis
ML Anomaly Detection
✅ Every metric
18 models per metric automatically
⚠️ Manual setup
Selected metrics only with configuration
Dashboard Sprawl
✅ Eliminated
Single interface adapts to all scenarios
❌ Dozens of dashboards
Separate dashboard per use case
Cost Model
✅ Predictable per-node
No per-metric or per-dashboard fees
❌ Volume-based
Per-host plus per-metric fees
MTTR Impact
✅ 80% reduction
Instant visibility and AI troubleshooting
⚠️ Slower resolution
Manual correlation and investigation
Netdata dashboards are an algorithm, not a configuration. Metrics organize automatically by semantic meaning, creating hierarchical views that adapt to your infrastructure. New systems appear instantly, deleted resources vanish cleanly - no manual updates, no dashboard sprawl.
Zero configuration, infinite adaptability
Learn About Zero Configuration
Why Netdata dashboards transform infrastructure monitoring
One-line install, with dashboards as soon as data is collected. No configuration, no query languages, no dashboard building - just immediate actionable insights.
Each chart is equivalent to 25+ Grafana charts. Slice, dice, group, filter, compare, and correlate - all with simple point-and-click interactions.
Per-second data collection with sub-2-second latency. See system behavior at console-tool resolution - catch issues invisible to minute-based monitoring.
Anomaly detection on every metric automatically. Anomaly Advisor surfaces root cause. AI troubleshooting explains issues in plain language with recommended actions.
Dashboards adapt automatically as infrastructure changes. No dashboard sprawl, no manual updates, no configuration drift - just continuous accurate visibility.
Junior engineers get senior-level visibility from day one. No specialized skills required. Same powerful interface for every team member regardless of experience.
Single pane of glass across all nodes, containers, services, and cloud resources. Correlate issues across your entire stack without context switching.
Simple per-node pricing with no per-metric charges and no per-dashboard fees. Monitor everything, every second, without surprise bills or forced sampling.

October 5, 2026
Netdata now ingests OpenTelemetry traces over OTLP on the same Agent that collects your metrics and logs. Spans are stored and indexed on your own infrastructure and explored in the new Traces tab in Netdata Cloud.

October 3, 2026
Your server monitoring dashboard shouldn't be a DIY project. Netdata charts every metric automatically — no query languages, no dashboards to build, ever.
September 8, 2026
Netdata AI now learns your infrastructure the way a new SRE would: a shared context document your team writes, and a memory layer built from conversations that gets more accurate every time you use it.