The only agent that thinks for itself

Autonomous Monitoring with self-learning AI built-in, operating independently across your entire stack.

Unlimited Metrics & Logs
Machine learning & MCP
5% CPU, 150MB RAM
3GB disk, >1 year retention
800+ integrations, zero config
Dashboards, alerts out of the box
> Discover Netdata Agents
Centralized metrics streaming and storage

Aggregate metrics from multiple agents into centralized Parent nodes for unified monitoring across your infrastructure.

Stream from unlimited agents
Long-term data retention
High availability clustering
Data replication & backup
Scalable architecture
Enterprise-grade security
> Learn about Parents
Fully managed cloud platform

Access your monitoring data from anywhere with our SaaS platform. No infrastructure to manage, automatic updates, and global availability.

Zero infrastructure management
99.9% uptime SLA
Global data centers
Automatic updates & patches
Enterprise SSO & RBAC
SOC2 & ISO certified
> Explore Netdata Cloud
Deploy Netdata Cloud in your infrastructure

Run the full Netdata Cloud platform on-premises for complete data sovereignty and compliance with your security policies.

Complete data sovereignty
Air-gapped deployment
Custom compliance controls
Private network integration
Dedicated support team
Kubernetes & Docker support
> Learn about Cloud On-Premises
Powerful, intuitive monitoring interface

Modern, responsive UI built for real-time troubleshooting with customizable dashboards and advanced visualization capabilities.

Real-time chart updates
Customizable dashboards
Dark & light themes
Advanced filtering & search
Responsive on all devices
Collaboration features
> Explore Netdata UI
Monitor on the go

Native iOS and Android apps bring full monitoring capabilities to your mobile device with real-time alerts and notifications.

iOS & Android apps
Push notifications
Touch-optimized interface
Offline data access
Biometric authentication
Widget support
> Download apps

Best energy efficiency

True real-time per-second

100% automated zero config

Centralized observability

Multi-year retention

High availability built-in

Zero maintenance

Always up-to-date

Enterprise security

Complete data control

Air-gap ready

Compliance certified

Millisecond responsiveness

Infinite zoom & pan

Works on any device

Native performance

Instant alerts

Monitor anywhere

80% Faster Incident Resolution
AI-powered troubleshooting from detection, to root cause and blast radius identification, to reporting.
True Real-Time and Simple, even at Scale
Linearly and infinitely scalable full-stack observability, that can be deployed even mid-crisis.
90% Cost Reduction, Full Fidelity
Instead of centralizing the data, Netdata distributes the code, eliminating pipelines and complexity.
Control Without Surrender
SOC 2 Type 2 certified with every metric kept on your infrastructure.
Integrations

800+ collectors and notification channels, auto-discovered and ready out of the box.

800+ data collectors
Auto-discovery & zero config
Cloud, infra, app protocols
Notifications out of the box
> Explore integrations
Real Results
46% Cost Reduction

Reduced monitoring costs by 46% while cutting staff overhead by 67%.

— Leonardo Antunez, Codyas

Zero Pipeline

No data shipping. No central storage costs. Query at the edge.

From Our Users
"Out-of-the-Box"

So many out-of-the-box features! I mostly don't have to develop anything.

— Simon Beginn, LANCOM Systems

No Query Language

Point-and-click troubleshooting. No PromQL, no LogQL, no learning curve.

Enterprise Ready
67% Less Staff, 46% Cost Cut

Enterprise efficiency without enterprise complexity—real ROI from day one.

— Leonardo Antunez, Codyas

SOC 2 Type 2 Certified

Zero data egress. Only metadata reaches the cloud. Your metrics stay on your infrastructure.

Full Coverage
800+ Collectors

Auto-discovered and configured. No manual setup required.

Any Notification Channel

Slack, PagerDuty, Teams, email, webhooks—all built-in.

From Our Users
"A Rare Unicorn"

Netdata gives more than you invest in it. A rare unicorn that obeys the Pareto rule.

— Eduard Porquet Mateu, TMB Barcelona

99% Downtime Reduction

Reduced website downtime by 99% and cloud bill by 30% using Netdata alerts.

— Falkland Islands Government

Real Savings
30% Cloud Cost Reduction

Optimized resource allocation based on Netdata alerts cut cloud spending by 30%.

— Falkland Islands Government

46% Cost Cut

Reduced monitoring staff by 67% while cutting operational costs by 46%.

— Codyas

Real Coverage
"Plugin for Everything"

Netdata has agent capacity or a plugin for everything, including Windows and Kubernetes.

— Eduard Porquet Mateu, TMB Barcelona

"Out-of-the-Box"

So many out-of-the-box features! I mostly don't have to develop anything.

— Simon Beginn, LANCOM Systems

Real Speed
Troubleshooting in 30 Seconds

From 2-3 minutes to 30 seconds—instant visibility into any node issue.

— Matthew Artist, Nodecraft

20% Downtime Reduction

20% less downtime and 40% budget optimization from out-of-the-box monitoring.

— Simon Beginn, LANCOM Systems

Pay per Node. Unlimited Everything Else.

One price per node. Unlimited metrics, logs, users, and retention. No per-GB surprises.

Free tier—forever
No metric limits or caps
Retention you control
Cancel anytime
> See pricing plans
What's Your Monitoring Really Costing You?

Most teams overpay by 40-60%. Let's find out why.

Expose hidden metric charges
Calculate tool consolidation
Customers report 30-67% savings
Results in under 60 seconds
> See what you're really paying
Your Infrastructure Is Unique. Let's Talk.

Because monitoring 10 nodes is different from monitoring 10,000.

On-prem & air-gapped deployment
Volume pricing & agreements
Architecture review for your scale
Compliance & security support
> Start a conversation
Monitoring That Sells Itself

Deploy in minutes. Impress clients in hours. Earn recurring revenue for years.

30-second live demos close deals
Zero config = zero support burden
Competitive margins & deal protection
Response in 48 hours
> Apply to partner
Per-Second Metrics at Homelab Prices

Same engine, same dashboards, same ML. Just priced for tinkerers.

Community: Free forever · 5 nodes · non-commercial
Homelab: $90/yr · unlimited nodes · fair usage
> Start monitoring your lab—free
$1,000 Per Referral. Unlimited Referrals.

Your colleagues get 10% off. You get 10% commission. Everyone wins.

10% of subscriptions, up to $1,000 each
Track earnings inside Netdata Cloud
PayPal/Venmo payouts in 3-4 weeks
No caps, no complexity
> Get your referral link
Cost Proof
40% Budget Optimization

"Netdata's significant positive impact" — LANCOM Systems

Calculate Your Savings

Compare vs Datadog, Grafana, Dynatrace

Savings Proof
46% Cost Reduction

"Cut costs by 46%, staff by 67%" — Codyas

30% Cloud Bill Savings

"Reduced cloud bill by 30%" — Falkland Islands Gov

Enterprise Proof
"Better Than Combined Alternatives"

"Better observability with Netdata than combining other tools." — TMB Barcelona

Real Engineers, <24h Response

DPA, SLAs, on-prem, volume pricing

Why Partners Win
Demo Live Infrastructure

One command, 30 seconds, real data—no sandbox needed

Zero Tickets, High Margins

Auto-config + per-node pricing = predictable profit

Homelab Ready
"Absolutely Incredible"

"We tested every monitoring system under the sun." — Benjamin Gabler, CEO Rocket.Net

76k+ GitHub Stars

3rd most starred monitoring project

Worth Recommending
Product That Delivers

Customers report 40-67% cost cuts, 99% downtime reduction

Zero Risk to Your Rep

Free tier lets them try before they buy

Never Fight Fires Alone

Docs, community, and expert help—pick your path to resolution.

Learn.netdata.cloud docs
Discord, Forums, GitHub
Premium support available
> Get answers now
60 Seconds to First Dashboard

One command to install. Zero config. 850+ integrations documented.

Linux, Windows, K8s, Docker
Auto-discovers your stack
> Start monitoring now
See Netdata in Action

Watch real-time monitoring in action—demos, tutorials, and engineering deep dives.

Product demos and walkthroughs
Real infrastructure, not staged
> Start with the 3-minute tour
Level Up Your Monitoring
Real problems. Real solutions. 112+ guides from basic monitoring to AI observability.
76,000+ Engineers Strong
615+ contributors. 1.5M daily downloads. One mission: simplify observability.
Per-Second. 90% Cheaper. Data Stays Home.
Side-by-side comparisons: costs, real-time granularity, and data sovereignty for every major tool.

See why teams switch from Datadog, Prometheus, Grafana, and more.

> Browse all comparisons
Edge-Native Observability, Born Open Source
Per-second visibility, ML on every metric, and data that never leaves your infrastructure.
Founded in 2016
615+ contributors worldwide
Remote-first, engineering-driven
Open source first
> Read our story
Promises We Publish—and Prove
12 principles backed by open code, independent validation, and measurable outcomes.
Open source, peer-reviewed
Zero config, instant value
Data sovereignty by design
Aligned pricing, no surprises
> See all 12 principles
Edge-Native, AI-Ready, 100% Open
76k+ stars. Full ML, AI, and automation—GPLv3+, not premium add-ons.
76,000+ GitHub stars
GPLv3+ licensed forever
ML on every metric, included
Zero vendor lock-in
> Explore our open source
Build Real-Time Observability for the World
Remote-first team shipping per-second monitoring with ML on every metric.
Remote-first, fully distributed
Open source (76k+ stars)
Challenging technical problems
Your code on millions of systems
> See open roles
Talk to a Netdata Human in <24 Hours
Sales, partnerships, press, or professional services—real engineers, fast answers.
Discuss your observability needs
Pricing and volume discounts
Partnership opportunities
Media and press inquiries
> Book a conversation
Your Data. Your Rules.
On-prem data, cloud control plane, transparent terms.
Trust & Scale
76,000+ GitHub Stars

One of the most popular open-source monitoring projects

SOC 2 Type 2 Certified

Enterprise-grade security and compliance

Data Sovereignty

Your metrics stay on your infrastructure

Validated
University of Amsterdam

"Most energy-efficient monitoring solution" — ICSOC 2023, peer-reviewed

ADASTEC (Autonomous Driving)

"Doesn't miss alerts—mission-critical trust for safety software"

Community Stats
615+ Contributors

Global community improving monitoring for everyone

1.5M+ Downloads/Day

Trusted by teams worldwide

GPLv3+ Licensed

Free forever, fully open source agent

Why Join?
Remote-First

Work from anywhere, async-friendly culture

Impact at Scale

Your work helps millions of systems

Compliance
SOC 2 Type 2

Audited security controls

GDPR Ready

Data stays on your infrastructure

AI & ML

Root Cause in Seconds, Not Hours

See exactly what broke, when it broke, and why - with ML that thinks in microseconds and AI that speaks your language. From alert to resolution in 5 minutes instead of 75.

Background Hero

Transform Incident Response

Six capabilities that redefine how fast you find and fix problems

Instant Anomaly Detection

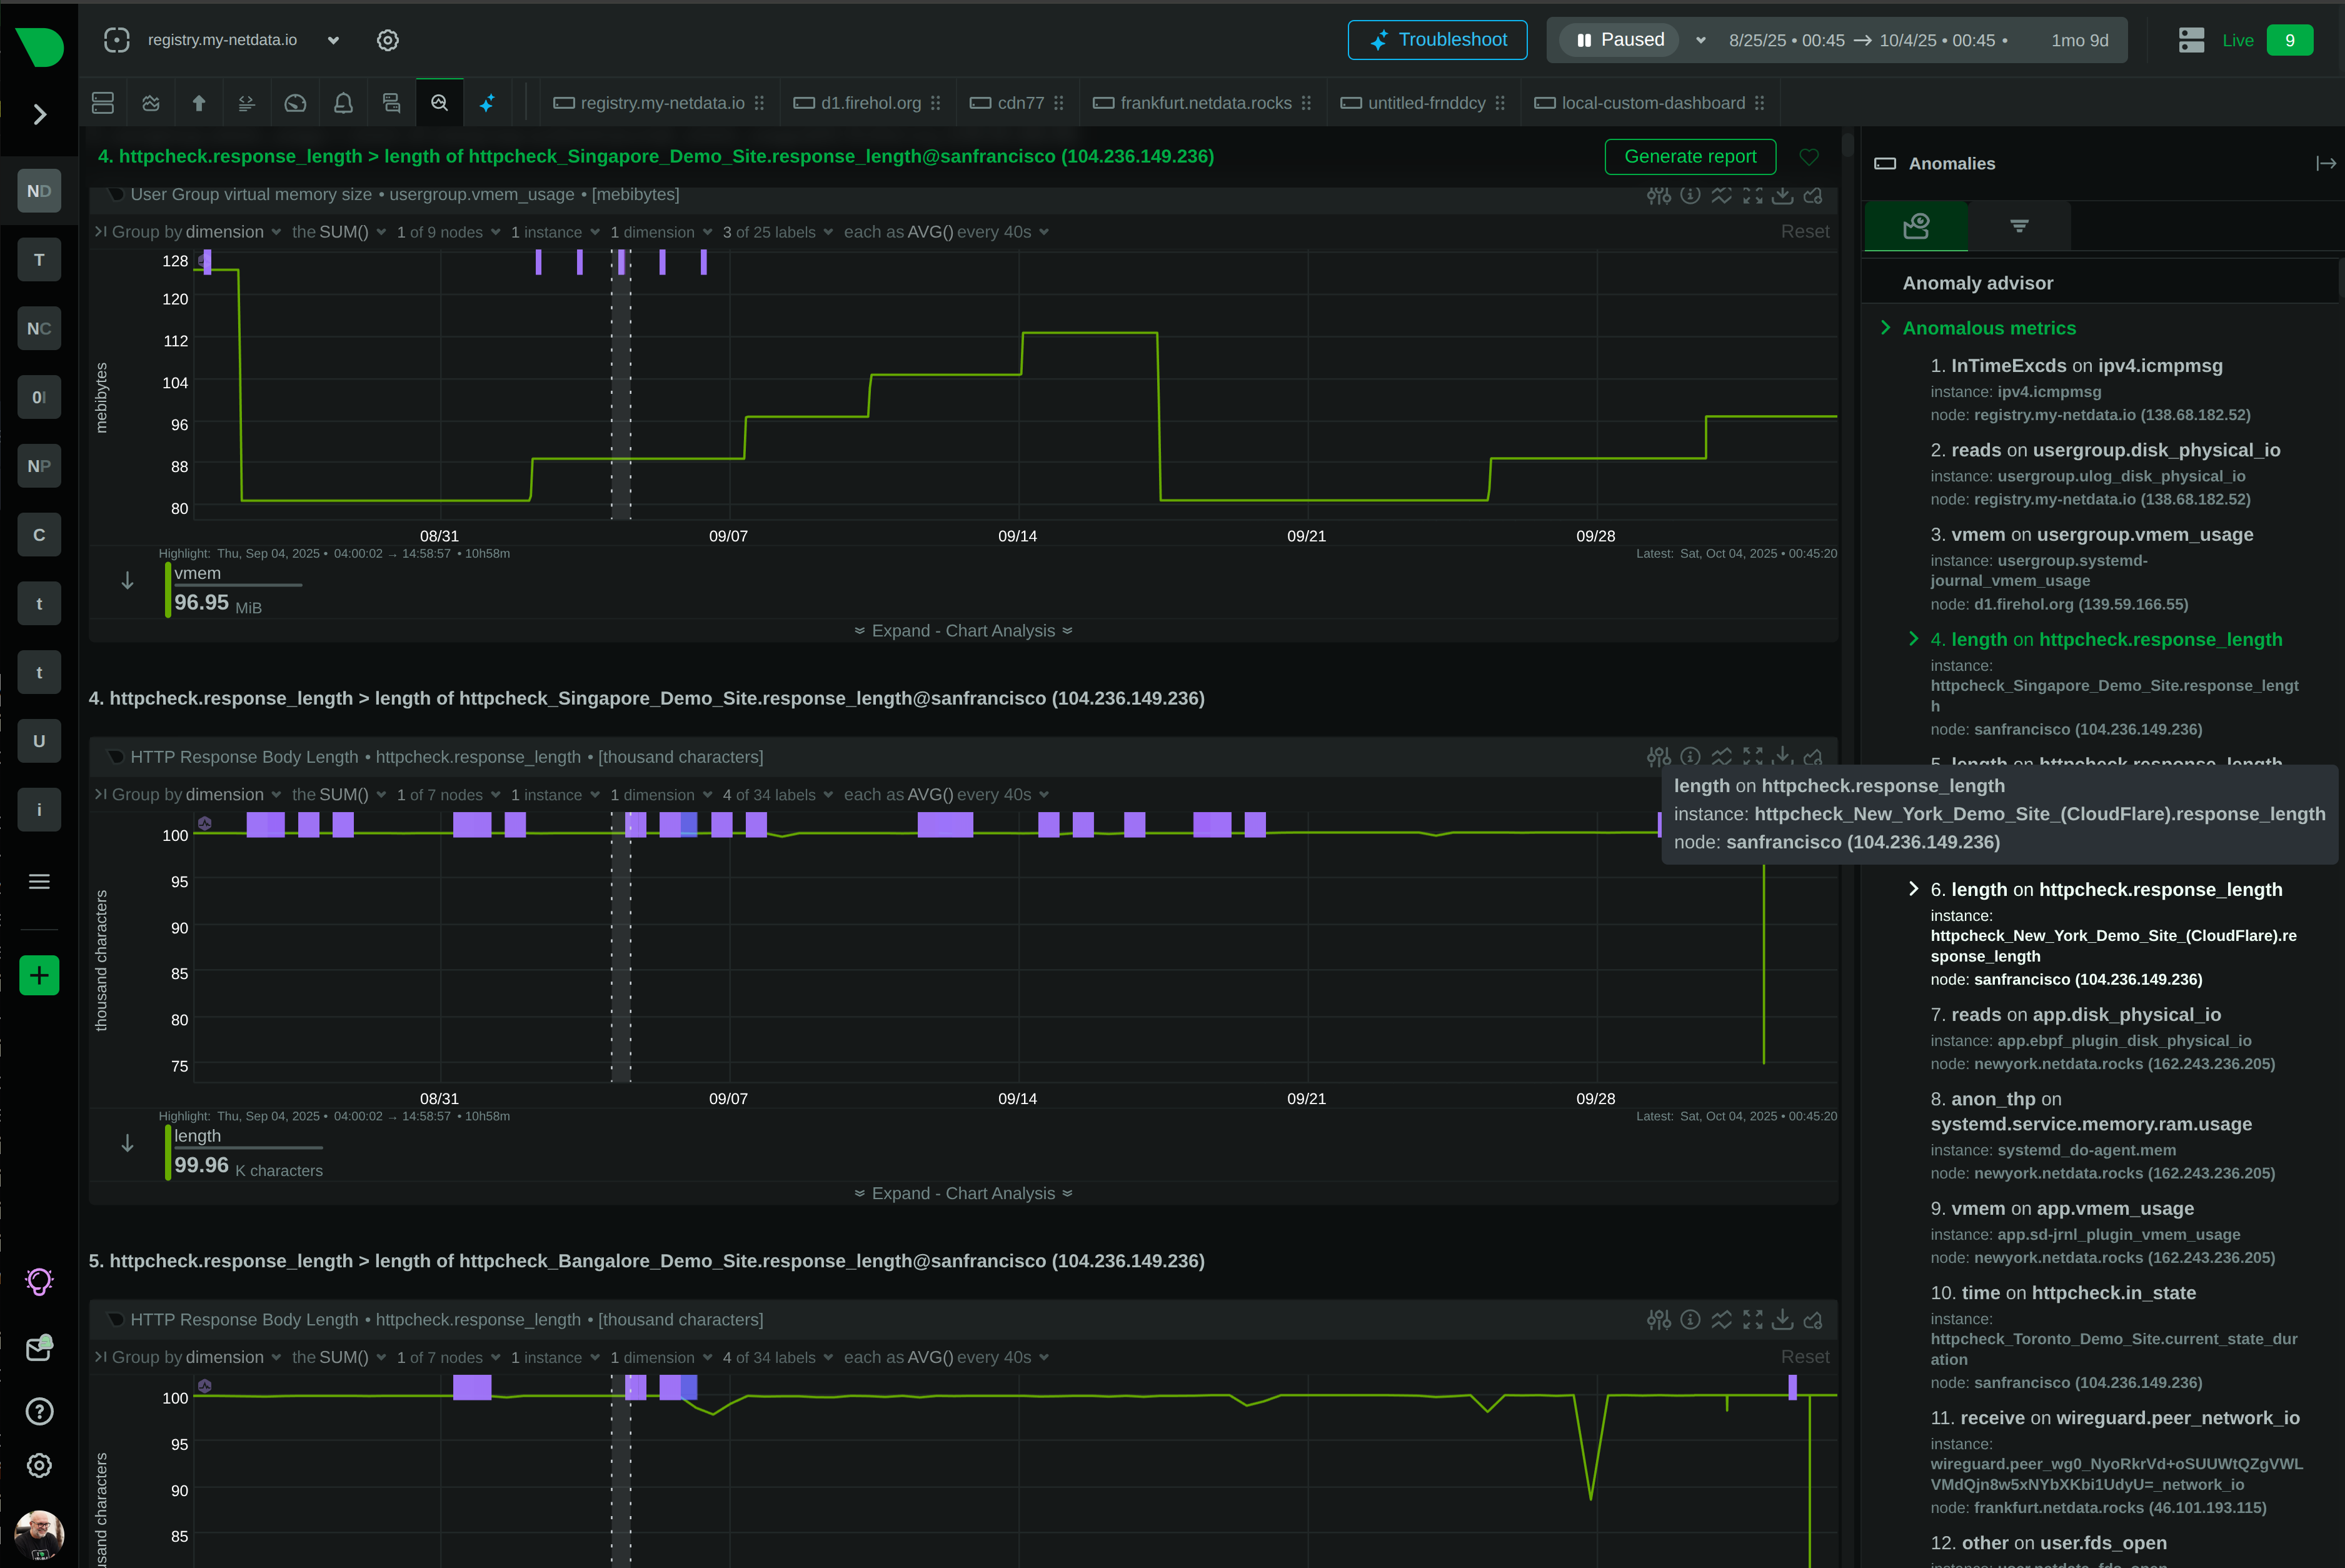
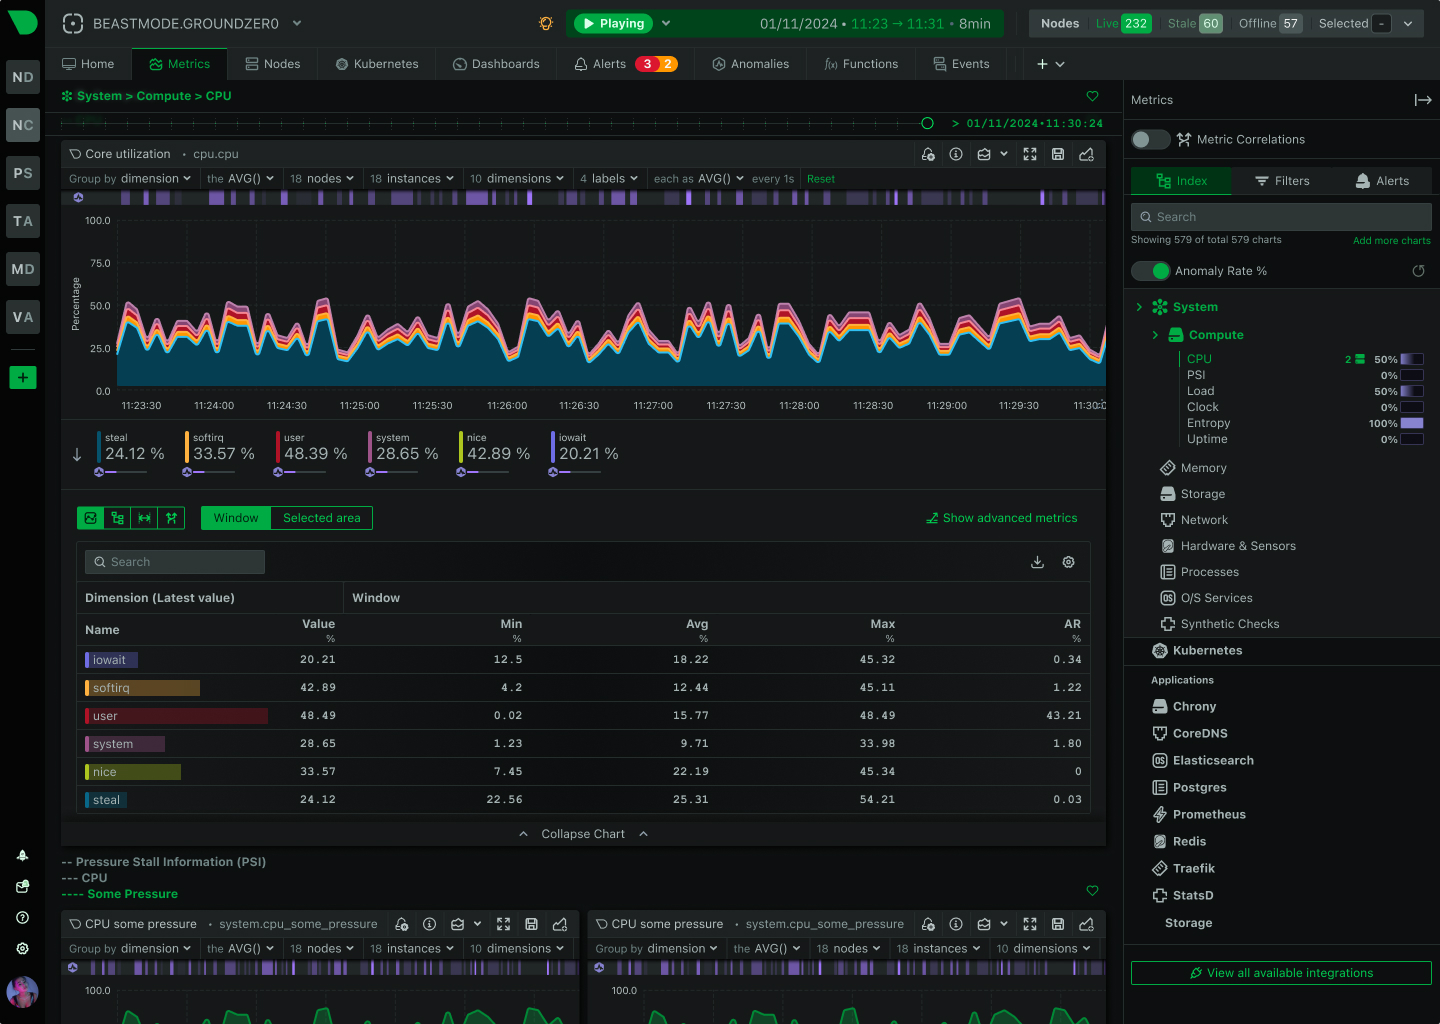
18 ML models per metric detect problems as they happen - no waiting for batch processing or manual threshold tuning.

Automated Correlation

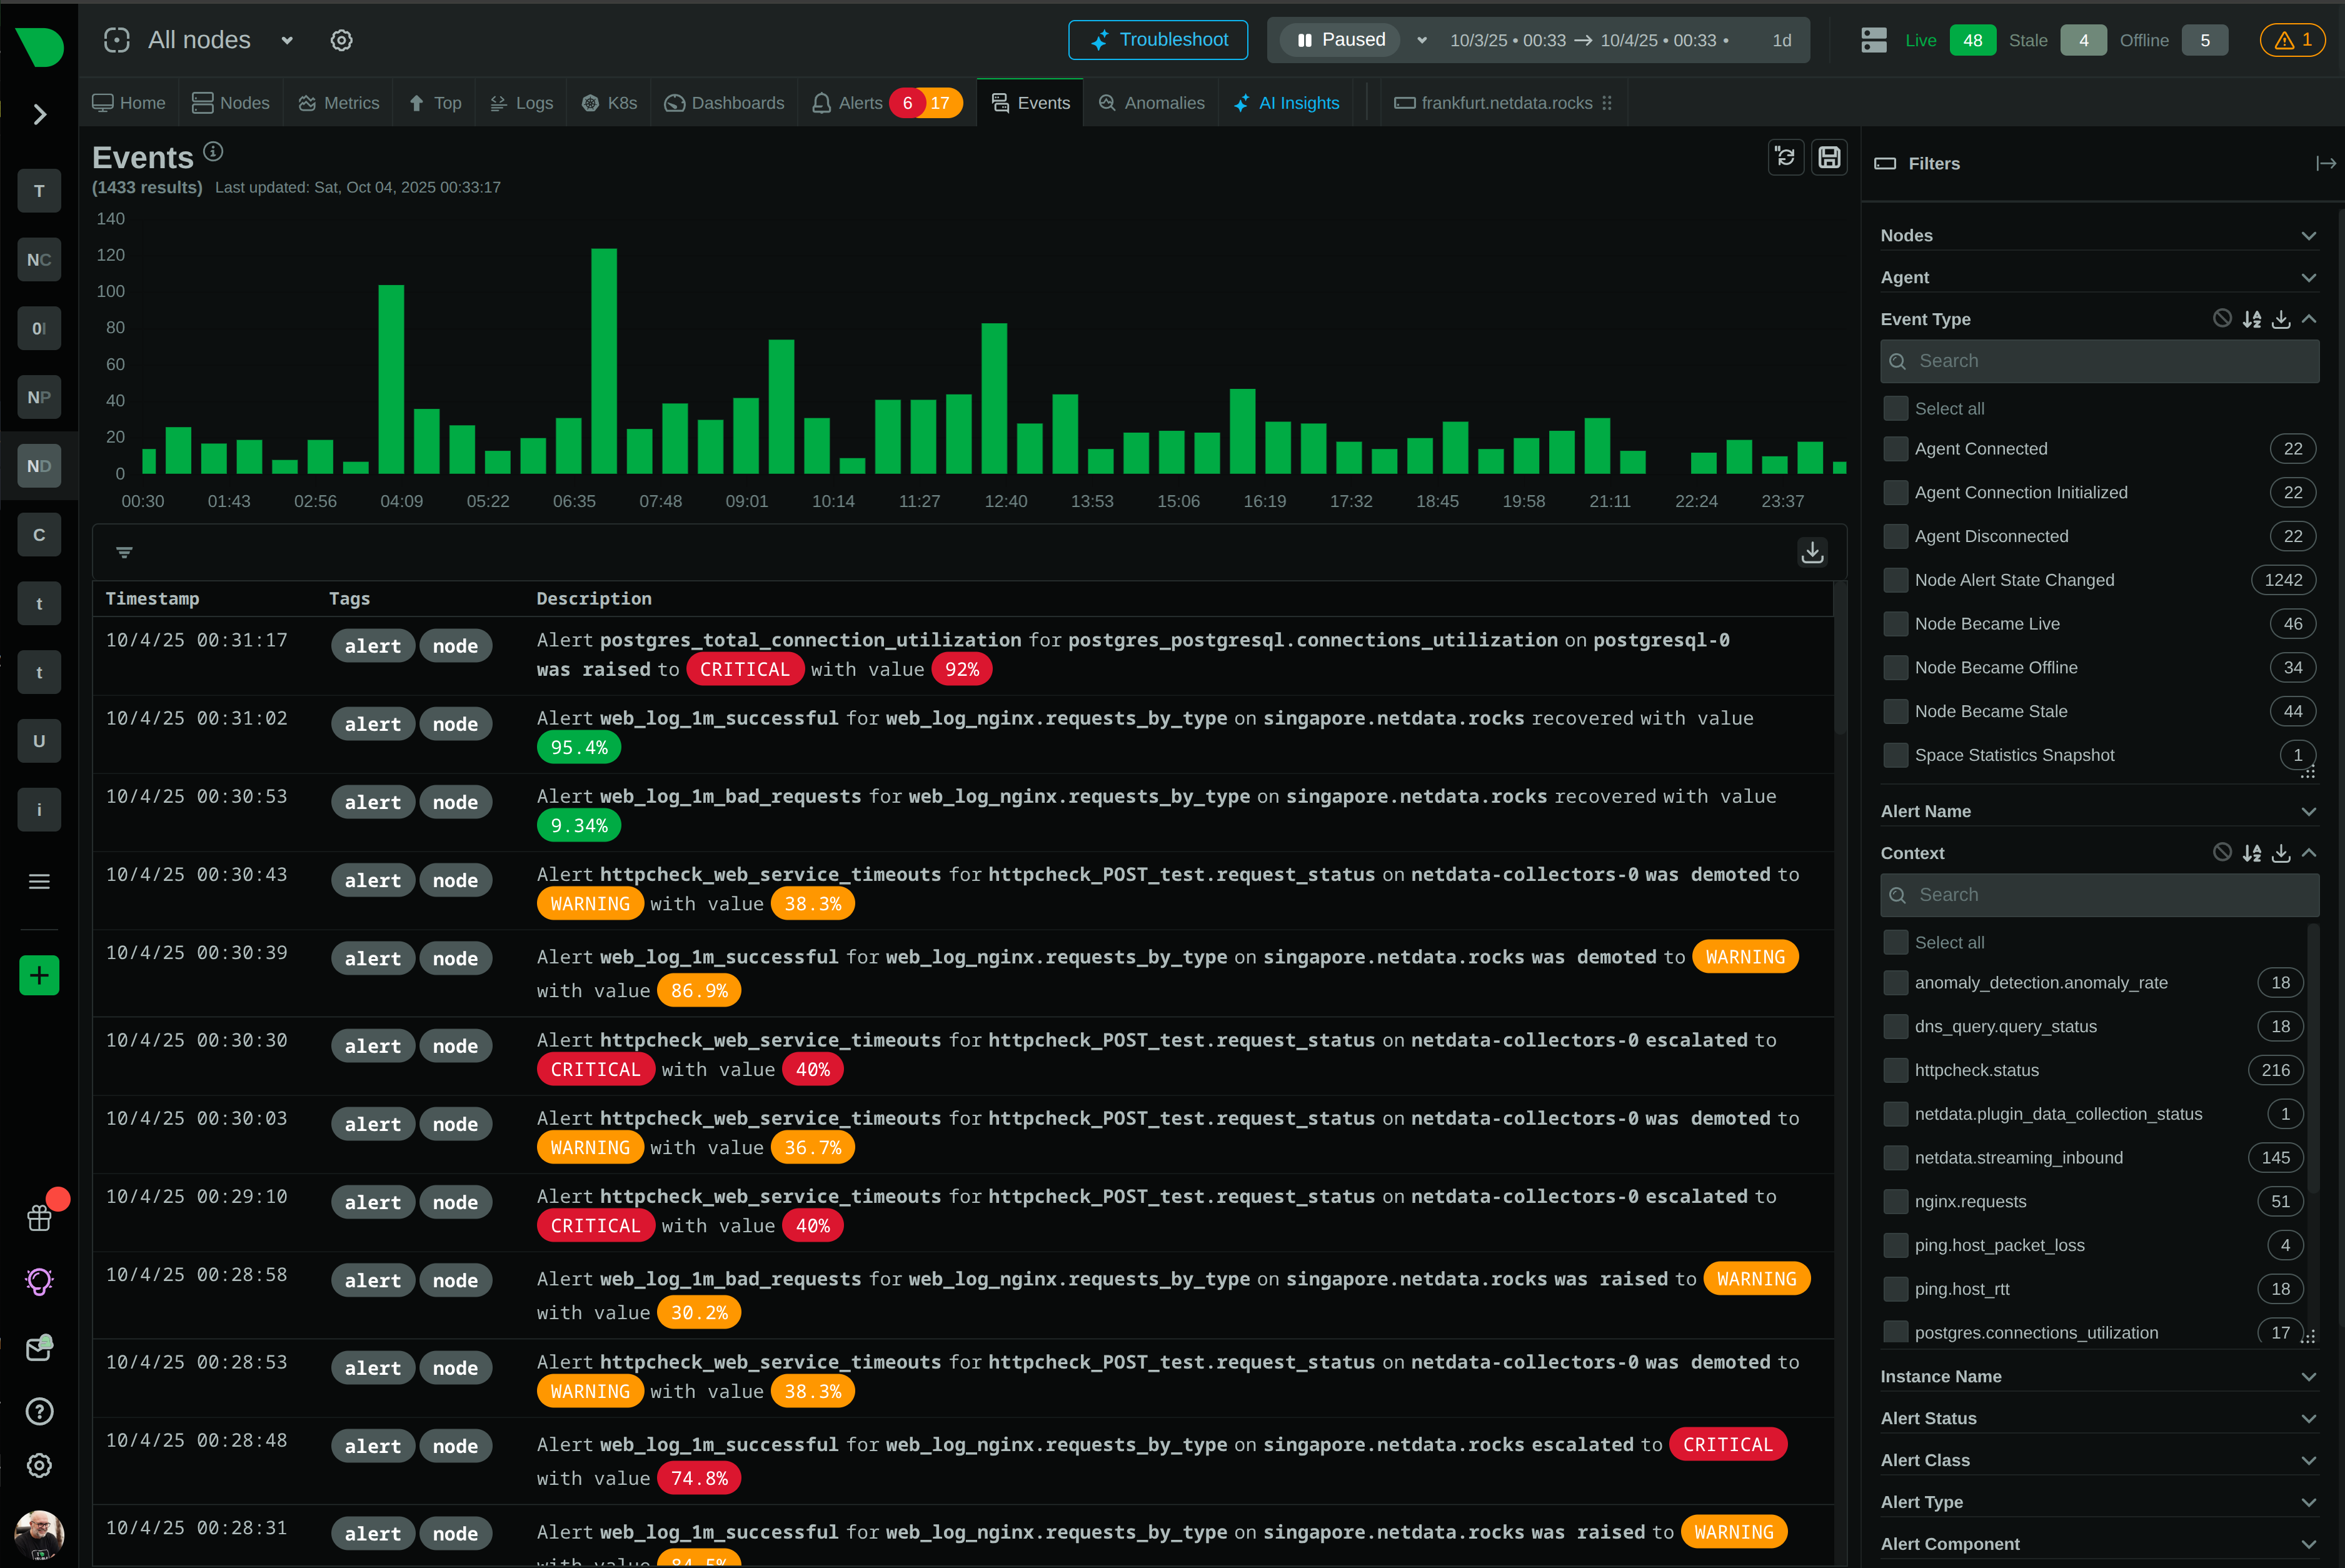
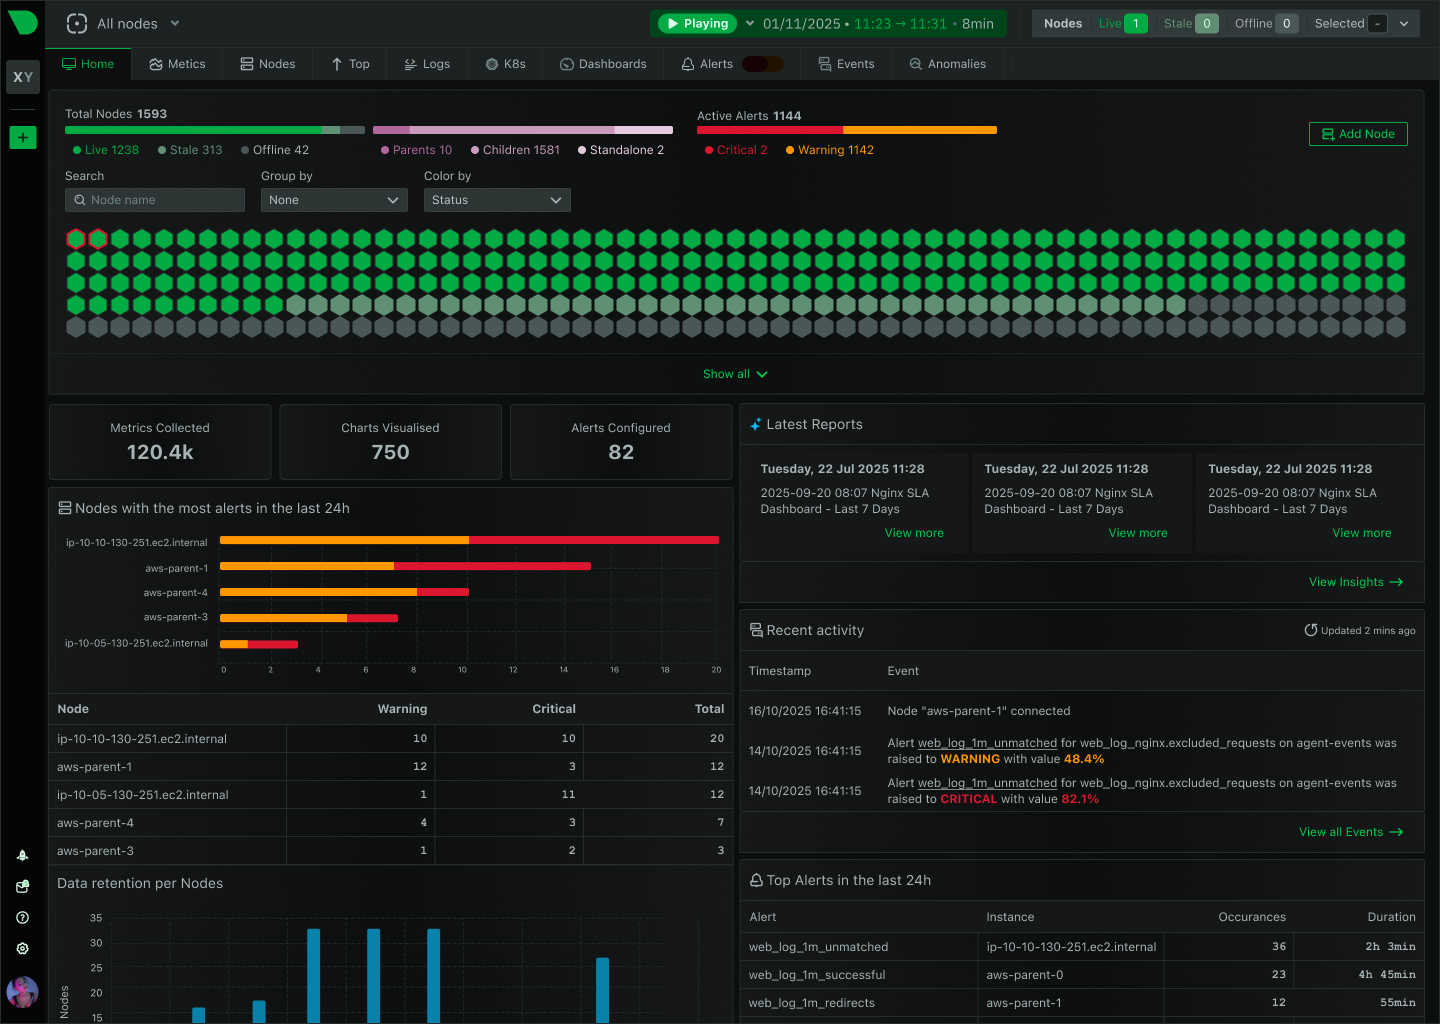
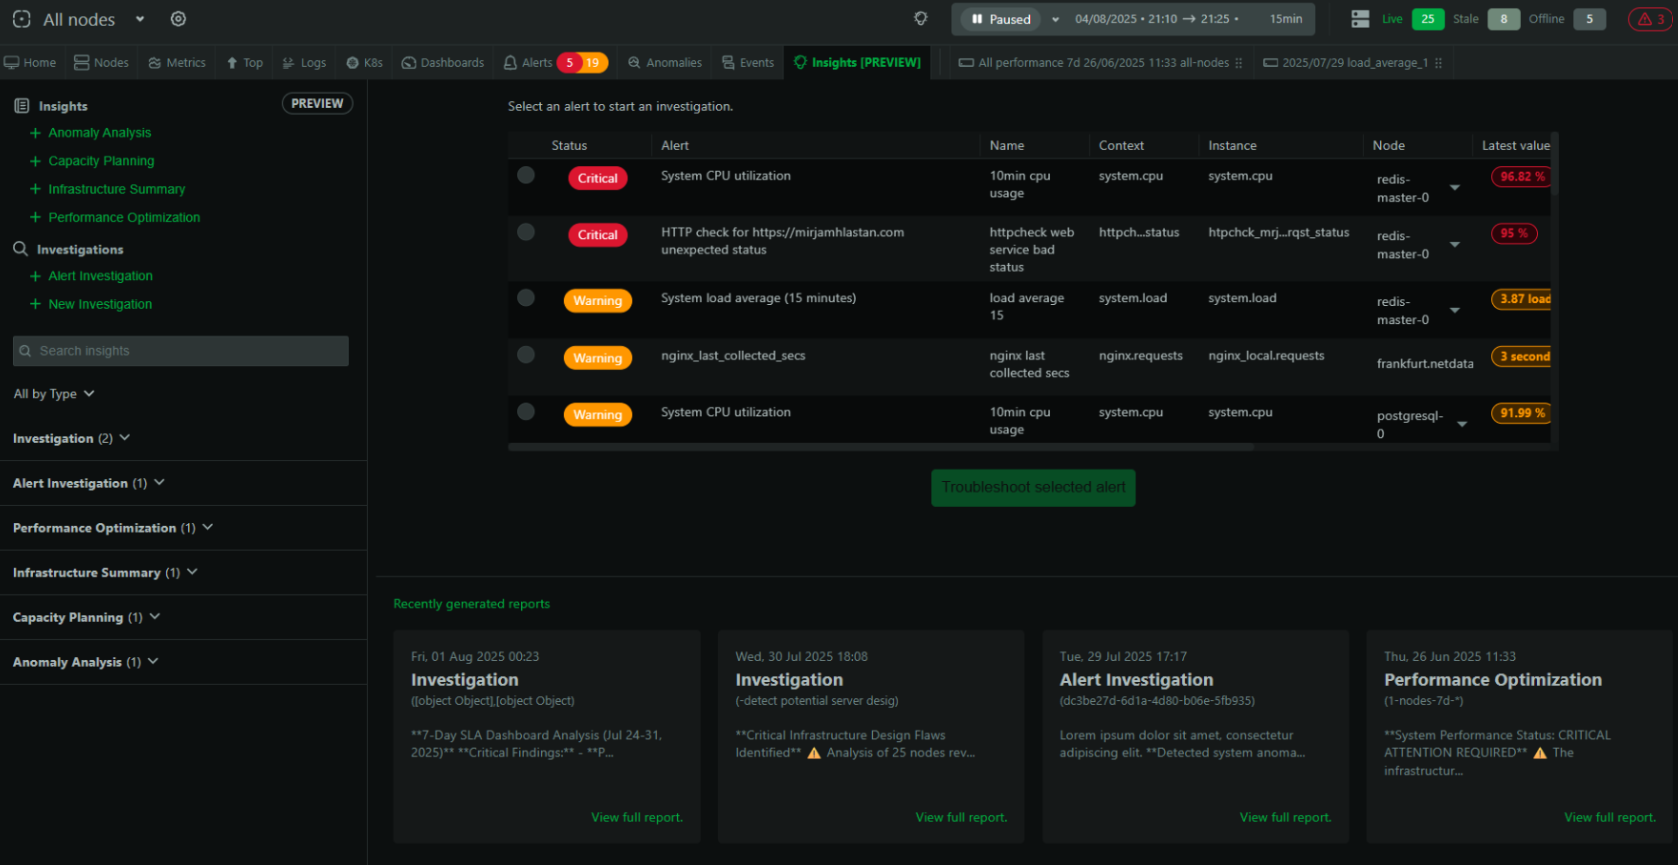
Evaluate thousands of metrics in seconds, surfacing root cause in the top 30-50 results - no manual dashboard hunting.

AI Explanations

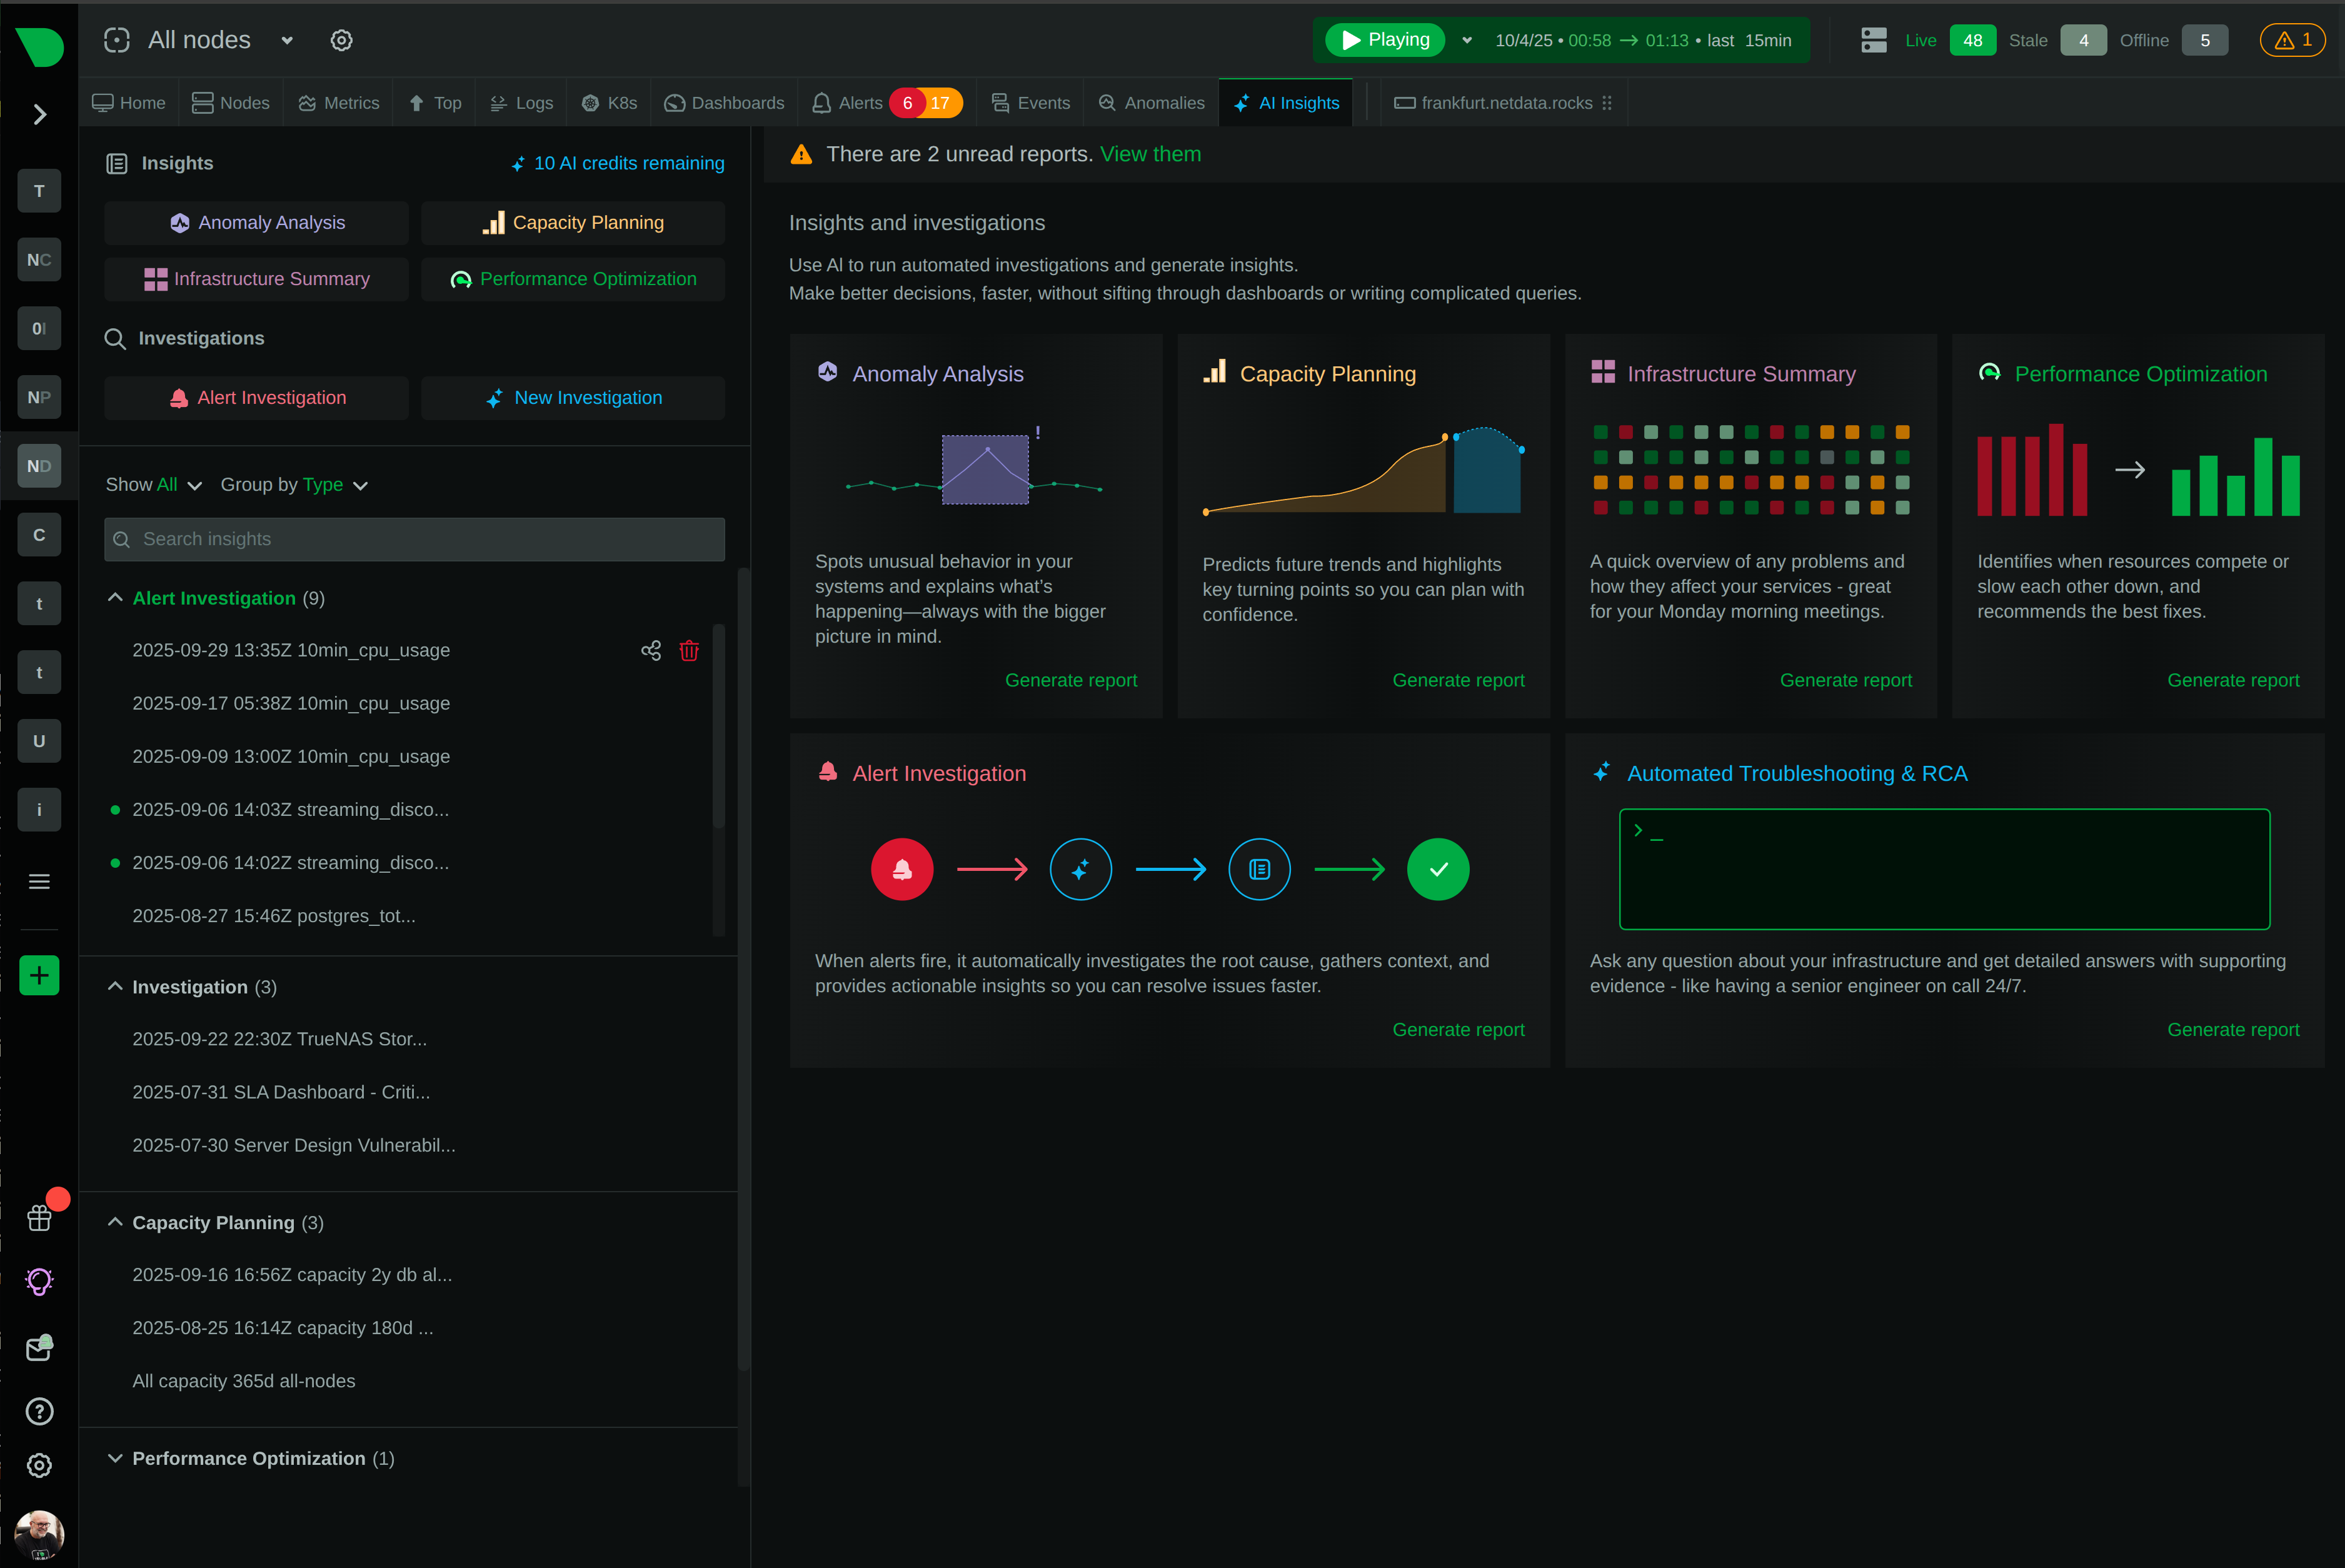
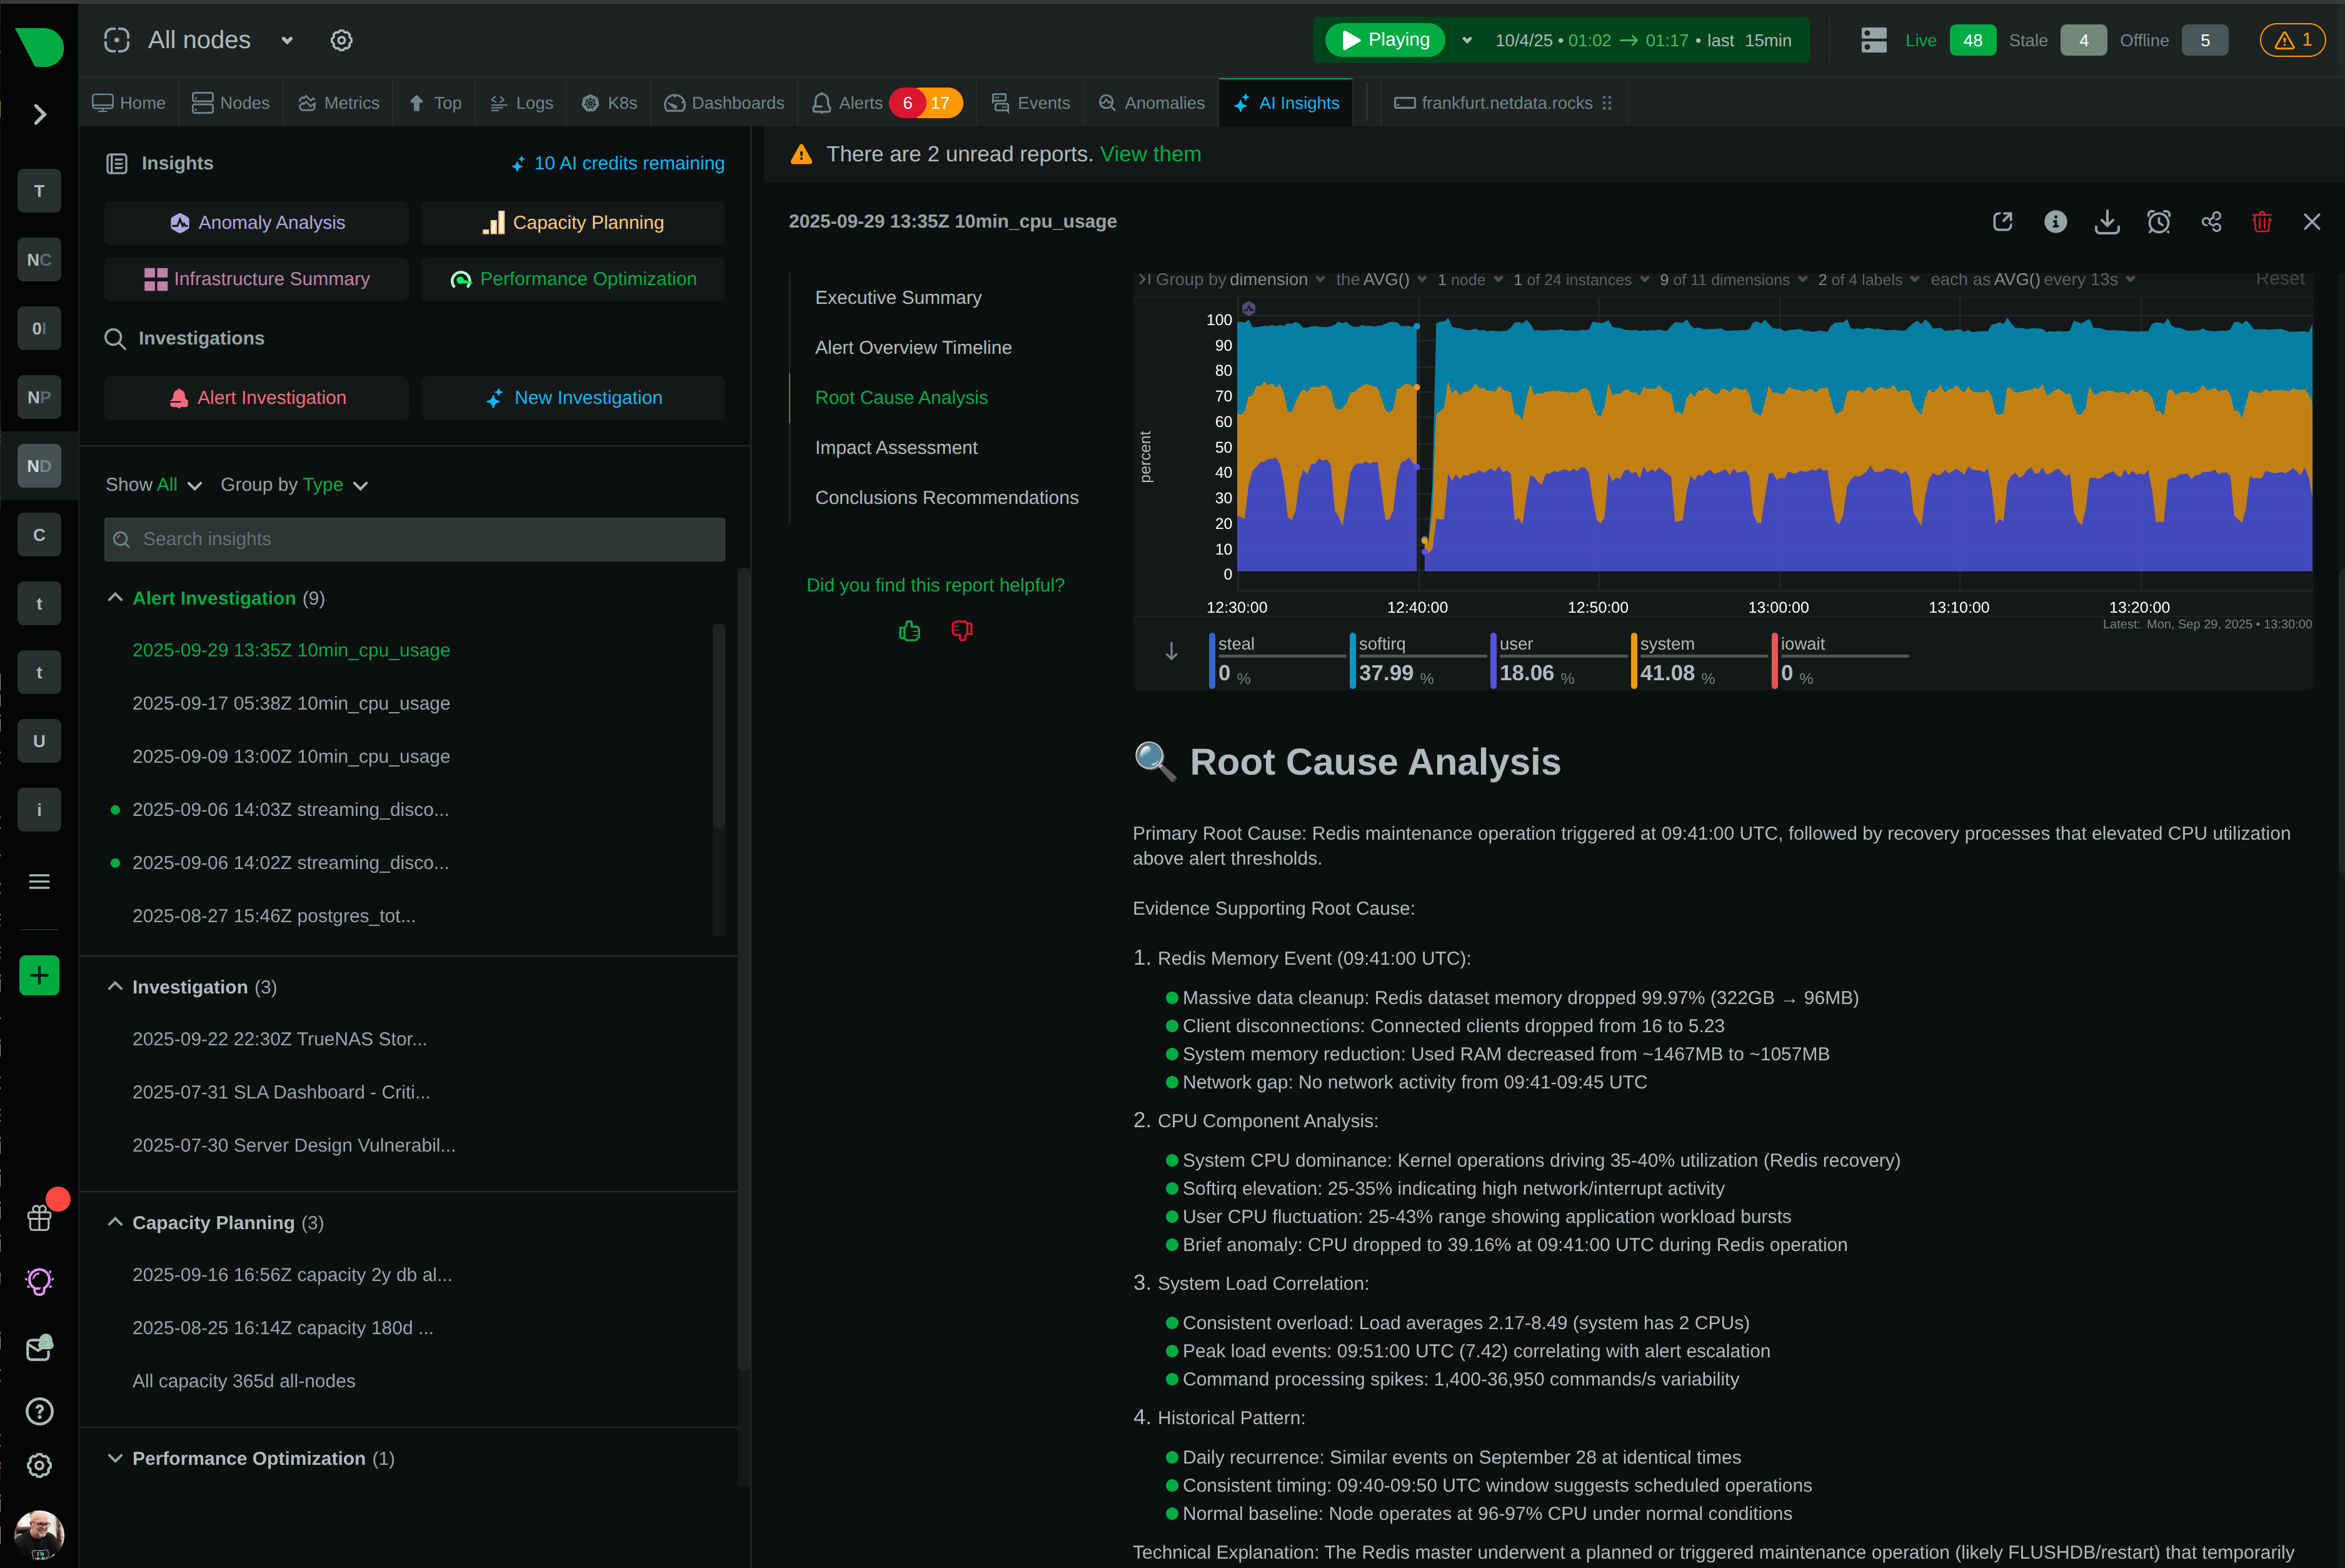
Get complete RCA reports in 2 minutes with hypothesis, evidence, and recommendations - in plain English.

Per-Second Visibility

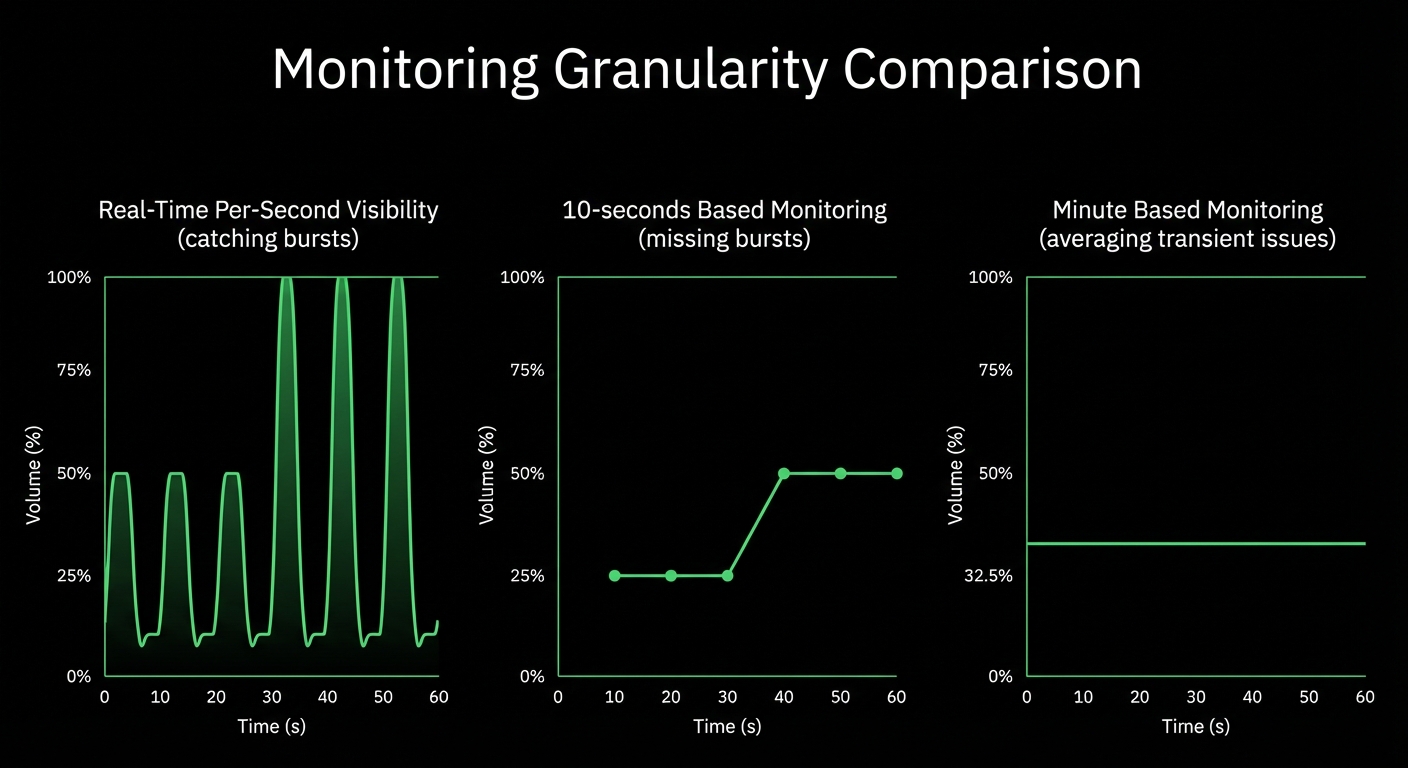
Capture transient failures that 30-second monitoring misses entirely - see the 3-second events that break systems.

Cascading Failure Detection

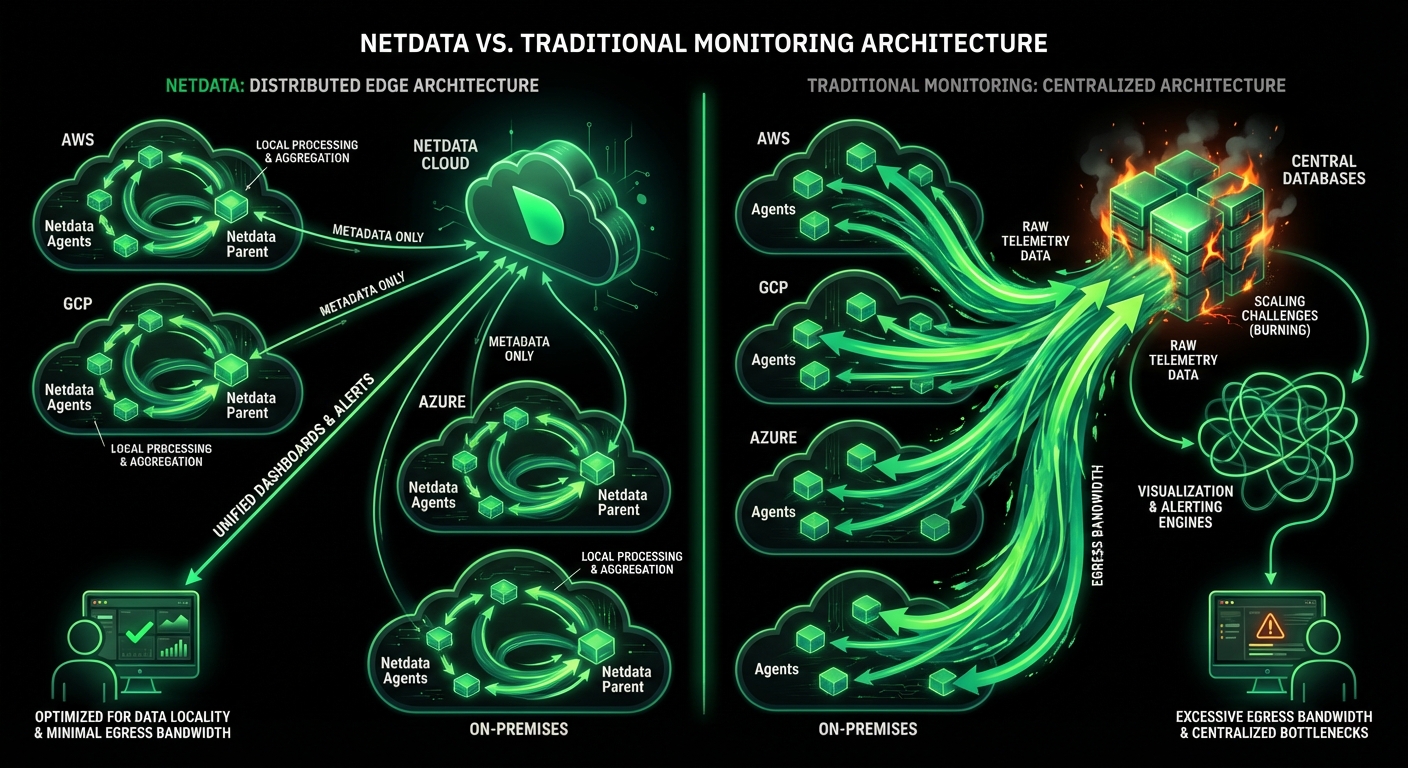
Watch failures propagate in real-time across distributed infrastructure - identify which component failed first.

Predictable Economics

Per-node pricing eliminates volume anxiety - unlimited metrics, logs, and users at 90% lower cost.

Trusted by DevOps teams worldwide

See What Others Miss

Capture Every Transient Event

Most operational anomalies last 2-10 seconds - database deadlocks, memory allocation failures, network microbursts, container lifecycle events. Traditional 30-second monitoring averages these away, leaving you blind to 90% of incidents. Netdata’s per-second collection captures every event with microsecond timestamp precision, providing 30× more training data for ML and enabling accurate timeline reconstruction to determine which component failed first.

86,400 samples/day per metric vs 2,880 for 30-second monitoring

Learn about real-time monitoring

Capture Every Transient Event

Get Answers in Seconds

Traditional RCA requires manually reviewing dashboards, writing queries, and correlating data across multiple tools - taking 75+ minutes on average. Netdata’s Anomaly Advisor evaluates thousands of metrics simultaneously in seconds, pre-computing Node Anomaly Rate charts updated every second. Root causes typically appear in the top 30-50 results, ranked by relevance. One-click AI troubleshooting generates complete reports in 2 minutes with hypothesis, evidence, and recommendations.

80% MTTR reduction - from 75 minutes to 5 minutes

Explore Anomaly Advisor

Get Answers in Seconds

Understand Cascading Failures

Modern applications span dozens to thousands of nodes where failures cascade across dependencies. Netdata’s infrastructure-level dashboards show anomalies across all nodes simultaneously with dual NAR chart views revealing both small nodes with high anomaly rates and large nodes with many anomalies. Visual cascade detection shows the exact sequence of which nodes failed when, enabling you to identify the initiating failure instead of chasing downstream symptoms.

Track failures across 100,000+ nodes in real-time

See distributed architecture

Understand Cascading Failures

Accurate Anomaly Signals

Netdata runs 18 independent ML models per metric, each trained on different 6-hour windows. An anomaly is only flagged when ALL 18 models agree - creating consensus that achieves a theoretical false positive rate of 10^-36 in anomaly detection. Unsupervised k-means clustering adapts to your infrastructure’s unique patterns without manual tuning, with continuous retraining every 3 hours maintaining model currency. This precision helps you identify what’s truly unusual in your infrastructure.

99% false positive reduction in anomaly detection

Learn about ML accuracy

Accurate Anomaly Signals

Investigate with Grounded AI

Current AI tools hallucinate plausible but incorrect explanations because they lack structural understanding of system dependencies. Netdata’s AI is fundamentally grounded in real-time ML anomaly detection running on every metric, every second, at the edge. When AI analyzes your infrastructure, it works with actual detected anomalies from 18 models per metric - not just statistical correlations. Choose managed AI in Netdata Cloud with optimized playbooks, or bring your own LLM via Model Context Protocol for complete control.

2-minute AI reports vs hours of manual investigation

Explore AI Co-Engineer

Investigate with Grounded AI

Maintain Data Sovereignty

Regulatory compliance (GDPR, HIPAA, PCI DSS) requires data residency, and security teams block vendors that require metric data transmission. Netdata keeps all observability data on-premises - only metadata (node names, chart titles) travels to Cloud for unified dashboards. Edge-based ML performs analysis locally without data transmission. For complete air-gapped environments, Netdata Cloud On-Prem provides the full control plane within your datacenter. SOC 2 Type 2 certified with comprehensive audit logging.

100% data sovereignty - metrics never leave your infrastructure

Review security design

Maintain Data Sovereignty

How Netdata Transforms RCA

Traditional vs Netdata Approach

See how Netdata’s edge-native architecture and ML-powered correlation fundamentally change root cause analysis - from hours of manual investigation to seconds of automated insight.

Capability

Netdata

Traditional Monitoring

Detection Speed

✅ Real-Time
Anomalies detected during data collection

⚠️ Delayed
Batch processing with minutes of lag

Data Granularity

✅ Per-Second
86,400 samples per day per metric

⚠️ Per-Minute
Misses 90% of transient events

ML Accuracy

✅ 18-Model Consensus
99% false positive reduction in anomaly detection

⚠️ Single-Model
Higher false positive rates

Correlation Speed

✅ Seconds
Evaluates thousands of metrics instantly

❌ Manual
Hours of dashboard review required

Root Cause Surfacing

✅ Top 30-50 Results
Automated ranking by relevance

❌ Manual Search
Engineers hunt through dashboards

AI Explanations

✅ 2-Minute Reports
Complete RCA with evidence

⚠️ Limited
Pattern matching without causality

Configuration Required

✅ Minimal
Auto-discovery and automated dashboards

❌ Extensive
Weeks of dashboard building

Average MTTR

✅ 5 Minutes
80% reduction from baseline

❌ 75+ Minutes
82% of companies exceed 1 hour

Cost Model

✅ Per-Node
Predictable, unlimited metrics/logs/users

❌ Volume-Based
Unpredictable, scales with data

Data Sovereignty

✅ Complete
All metrics stay on-premises

⚠️ Limited
Telemetry shipped to vendor

See Full Platform Comparison →

How Netdata Accelerates RCA

Spot Anomalies Instantly

18 ML models per metric detect problems as they happen during data collection - no batch processing delays. Consensus-based flagging achieves 99% false positive reduction in anomaly detection while unsupervised learning adapts to your infrastructure's unique patterns.

15 minutes to first ML detection after installation

Learn about ML accuracy
Detection Dashboard

Key RCA Capabilities

Essential features that transform incident response from reactive firefighting to proactive problem-solving

Frequently Asked Questions