The only agent that thinks for itself

Autonomous Monitoring with self-learning AI built-in, operating independently across your entire stack.

Unlimited Metrics & Logs
Machine learning & MCP
5% CPU, 150MB RAM
3GB disk, >1 year retention
800+ integrations, zero config
Dashboards, alerts out of the box
> Discover Netdata Agents
Centralized metrics streaming and storage

Aggregate metrics from multiple agents into centralized Parent nodes for unified monitoring across your infrastructure.

Stream from unlimited agents
Long-term data retention
High availability clustering
Data replication & backup
Scalable architecture
Enterprise-grade security
> Learn about Parents
Fully managed cloud platform

Access your monitoring data from anywhere with our SaaS platform. No infrastructure to manage, automatic updates, and global availability.

Zero infrastructure management
99.9% uptime SLA
Global data centers
Automatic updates & patches
Enterprise SSO & RBAC
SOC2 & ISO certified
> Explore Netdata Cloud
Deploy Netdata Cloud in your infrastructure

Run the full Netdata Cloud platform on-premises for complete data sovereignty and compliance with your security policies.

Complete data sovereignty
Air-gapped deployment
Custom compliance controls
Private network integration
Dedicated support team
Kubernetes & Docker support
> Learn about Cloud On-Premises
Powerful, intuitive monitoring interface

Modern, responsive UI built for real-time troubleshooting with customizable dashboards and advanced visualization capabilities.

Real-time chart updates
Customizable dashboards
Dark & light themes
Advanced filtering & search
Responsive on all devices
Collaboration features
> Explore Netdata UI
Monitor on the go

Native iOS and Android apps bring full monitoring capabilities to your mobile device with real-time alerts and notifications.

iOS & Android apps
Push notifications
Touch-optimized interface
Offline data access
Biometric authentication
Widget support
> Download apps

Best energy efficiency

True real-time per-second

100% automated zero config

Centralized observability

Multi-year retention

High availability built-in

Zero maintenance

Always up-to-date

Enterprise security

Complete data control

Air-gap ready

Compliance certified

Millisecond responsiveness

Infinite zoom & pan

Works on any device

Native performance

Instant alerts

Monitor anywhere

80% Faster Incident Resolution
AI-powered troubleshooting from detection, to root cause and blast radius identification, to reporting.
True Real-Time and Simple, even at Scale
Linearly and infinitely scalable full-stack observability, that can be deployed even mid-crisis.
90% Cost Reduction, Full Fidelity
Instead of centralizing the data, Netdata distributes the code, eliminating pipelines and complexity.
Control Without Surrender
SOC 2 Type 2 certified with every metric kept on your infrastructure.
Integrations

800+ collectors and notification channels, auto-discovered and ready out of the box.

800+ data collectors
Auto-discovery & zero config
Cloud, infra, app protocols
Notifications out of the box
> Explore integrations
Real Results
46% Cost Reduction

Reduced monitoring costs by 46% while cutting staff overhead by 67%.

— Leonardo Antunez, Codyas

Zero Pipeline

No data shipping. No central storage costs. Query at the edge.

From Our Users
"Out-of-the-Box"

So many out-of-the-box features! I mostly don't have to develop anything.

— Simon Beginn, LANCOM Systems

No Query Language

Point-and-click troubleshooting. No PromQL, no LogQL, no learning curve.

Enterprise Ready
67% Less Staff, 46% Cost Cut

Enterprise efficiency without enterprise complexity—real ROI from day one.

— Leonardo Antunez, Codyas

SOC 2 Type 2 Certified

Zero data egress. Only metadata reaches the cloud. Your metrics stay on your infrastructure.

Full Coverage
800+ Collectors

Auto-discovered and configured. No manual setup required.

Any Notification Channel

Slack, PagerDuty, Teams, email, webhooks—all built-in.

From Our Users
"A Rare Unicorn"

Netdata gives more than you invest in it. A rare unicorn that obeys the Pareto rule.

— Eduard Porquet Mateu, TMB Barcelona

99% Downtime Reduction

Reduced website downtime by 99% and cloud bill by 30% using Netdata alerts.

— Falkland Islands Government

Real Savings
30% Cloud Cost Reduction

Optimized resource allocation based on Netdata alerts cut cloud spending by 30%.

— Falkland Islands Government

46% Cost Cut

Reduced monitoring staff by 67% while cutting operational costs by 46%.

— Codyas

Real Coverage
"Plugin for Everything"

Netdata has agent capacity or a plugin for everything, including Windows and Kubernetes.

— Eduard Porquet Mateu, TMB Barcelona

"Out-of-the-Box"

So many out-of-the-box features! I mostly don't have to develop anything.

— Simon Beginn, LANCOM Systems

Real Speed
Troubleshooting in 30 Seconds

From 2-3 minutes to 30 seconds—instant visibility into any node issue.

— Matthew Artist, Nodecraft

20% Downtime Reduction

20% less downtime and 40% budget optimization from out-of-the-box monitoring.

— Simon Beginn, LANCOM Systems

Pay per Node. Unlimited Everything Else.

One price per node. Unlimited metrics, logs, users, and retention. No per-GB surprises.

Free tier—forever
No metric limits or caps
Retention you control
Cancel anytime
> See pricing plans
What's Your Monitoring Really Costing You?

Most teams overpay by 40-60%. Let's find out why.

Expose hidden metric charges
Calculate tool consolidation
Customers report 30-67% savings
Results in under 60 seconds
> See what you're really paying
Your Infrastructure Is Unique. Let's Talk.

Because monitoring 10 nodes is different from monitoring 10,000.

On-prem & air-gapped deployment
Volume pricing & agreements
Architecture review for your scale
Compliance & security support
> Start a conversation
Monitoring That Sells Itself

Deploy in minutes. Impress clients in hours. Earn recurring revenue for years.

30-second live demos close deals
Zero config = zero support burden
Competitive margins & deal protection
Response in 48 hours
> Apply to partner
Per-Second Metrics at Homelab Prices

Same engine, same dashboards, same ML. Just priced for tinkerers.

Community: Free forever · 5 nodes · non-commercial
Homelab: $90/yr · unlimited nodes · fair usage
> Start monitoring your lab—free
$1,000 Per Referral. Unlimited Referrals.

Your colleagues get 10% off. You get 10% commission. Everyone wins.

10% of subscriptions, up to $1,000 each
Track earnings inside Netdata Cloud
PayPal/Venmo payouts in 3-4 weeks
No caps, no complexity
> Get your referral link
Cost Proof
40% Budget Optimization

"Netdata's significant positive impact" — LANCOM Systems

Calculate Your Savings

Compare vs Datadog, Grafana, Dynatrace

Savings Proof
46% Cost Reduction

"Cut costs by 46%, staff by 67%" — Codyas

30% Cloud Bill Savings

"Reduced cloud bill by 30%" — Falkland Islands Gov

Enterprise Proof
"Better Than Combined Alternatives"

"Better observability with Netdata than combining other tools." — TMB Barcelona

Real Engineers, <24h Response

DPA, SLAs, on-prem, volume pricing

Why Partners Win
Demo Live Infrastructure

One command, 30 seconds, real data—no sandbox needed

Zero Tickets, High Margins

Auto-config + per-node pricing = predictable profit

Homelab Ready
"Absolutely Incredible"

"We tested every monitoring system under the sun." — Benjamin Gabler, CEO Rocket.Net

76k+ GitHub Stars

3rd most starred monitoring project

Worth Recommending
Product That Delivers

Customers report 40-67% cost cuts, 99% downtime reduction

Zero Risk to Your Rep

Free tier lets them try before they buy

Never Fight Fires Alone

Docs, community, and expert help—pick your path to resolution.

Learn.netdata.cloud docs
Discord, Forums, GitHub
Premium support available
> Get answers now
60 Seconds to First Dashboard

One command to install. Zero config. 850+ integrations documented.

Linux, Windows, K8s, Docker
Auto-discovers your stack
> Start monitoring now
See Netdata in Action

Watch real-time monitoring in action—demos, tutorials, and engineering deep dives.

Product demos and walkthroughs
Real infrastructure, not staged
> Start with the 3-minute tour
Level Up Your Monitoring
Real problems. Real solutions. 112+ guides from basic monitoring to AI observability.
76,000+ Engineers Strong
615+ contributors. 1.5M daily downloads. One mission: simplify observability.
Per-Second. 90% Cheaper. Data Stays Home.
Side-by-side comparisons: costs, real-time granularity, and data sovereignty for every major tool.

See why teams switch from Datadog, Prometheus, Grafana, and more.

> Browse all comparisons
Edge-Native Observability, Born Open Source
Per-second visibility, ML on every metric, and data that never leaves your infrastructure.
Founded in 2016
615+ contributors worldwide
Remote-first, engineering-driven
Open source first
> Read our story
Promises We Publish—and Prove
12 principles backed by open code, independent validation, and measurable outcomes.
Open source, peer-reviewed
Zero config, instant value
Data sovereignty by design
Aligned pricing, no surprises
> See all 12 principles
Edge-Native, AI-Ready, 100% Open
76k+ stars. Full ML, AI, and automation—GPLv3+, not premium add-ons.
76,000+ GitHub stars
GPLv3+ licensed forever
ML on every metric, included
Zero vendor lock-in
> Explore our open source
Build Real-Time Observability for the World
Remote-first team shipping per-second monitoring with ML on every metric.
Remote-first, fully distributed
Open source (76k+ stars)
Challenging technical problems
Your code on millions of systems
> See open roles
Talk to a Netdata Human in <24 Hours
Sales, partnerships, press, or professional services—real engineers, fast answers.
Discuss your observability needs
Pricing and volume discounts
Partnership opportunities
Media and press inquiries
> Book a conversation
Your Data. Your Rules.
On-prem data, cloud control plane, transparent terms.
Trust & Scale
76,000+ GitHub Stars

One of the most popular open-source monitoring projects

SOC 2 Type 2 Certified

Enterprise-grade security and compliance

Data Sovereignty

Your metrics stay on your infrastructure

Validated
University of Amsterdam

"Most energy-efficient monitoring solution" — ICSOC 2023, peer-reviewed

ADASTEC (Autonomous Driving)

"Doesn't miss alerts—mission-critical trust for safety software"

Community Stats
615+ Contributors

Global community improving monitoring for everyone

1.5M+ Downloads/Day

Trusted by teams worldwide

GPLv3+ Licensed

Free forever, fully open source agent

Why Join?
Remote-First

Work from anywhere, async-friendly culture

Impact at Scale

Your work helps millions of systems

Compliance
SOC 2 Type 2

Audited security controls

GDPR Ready

Data stays on your infrastructure

AI & ML

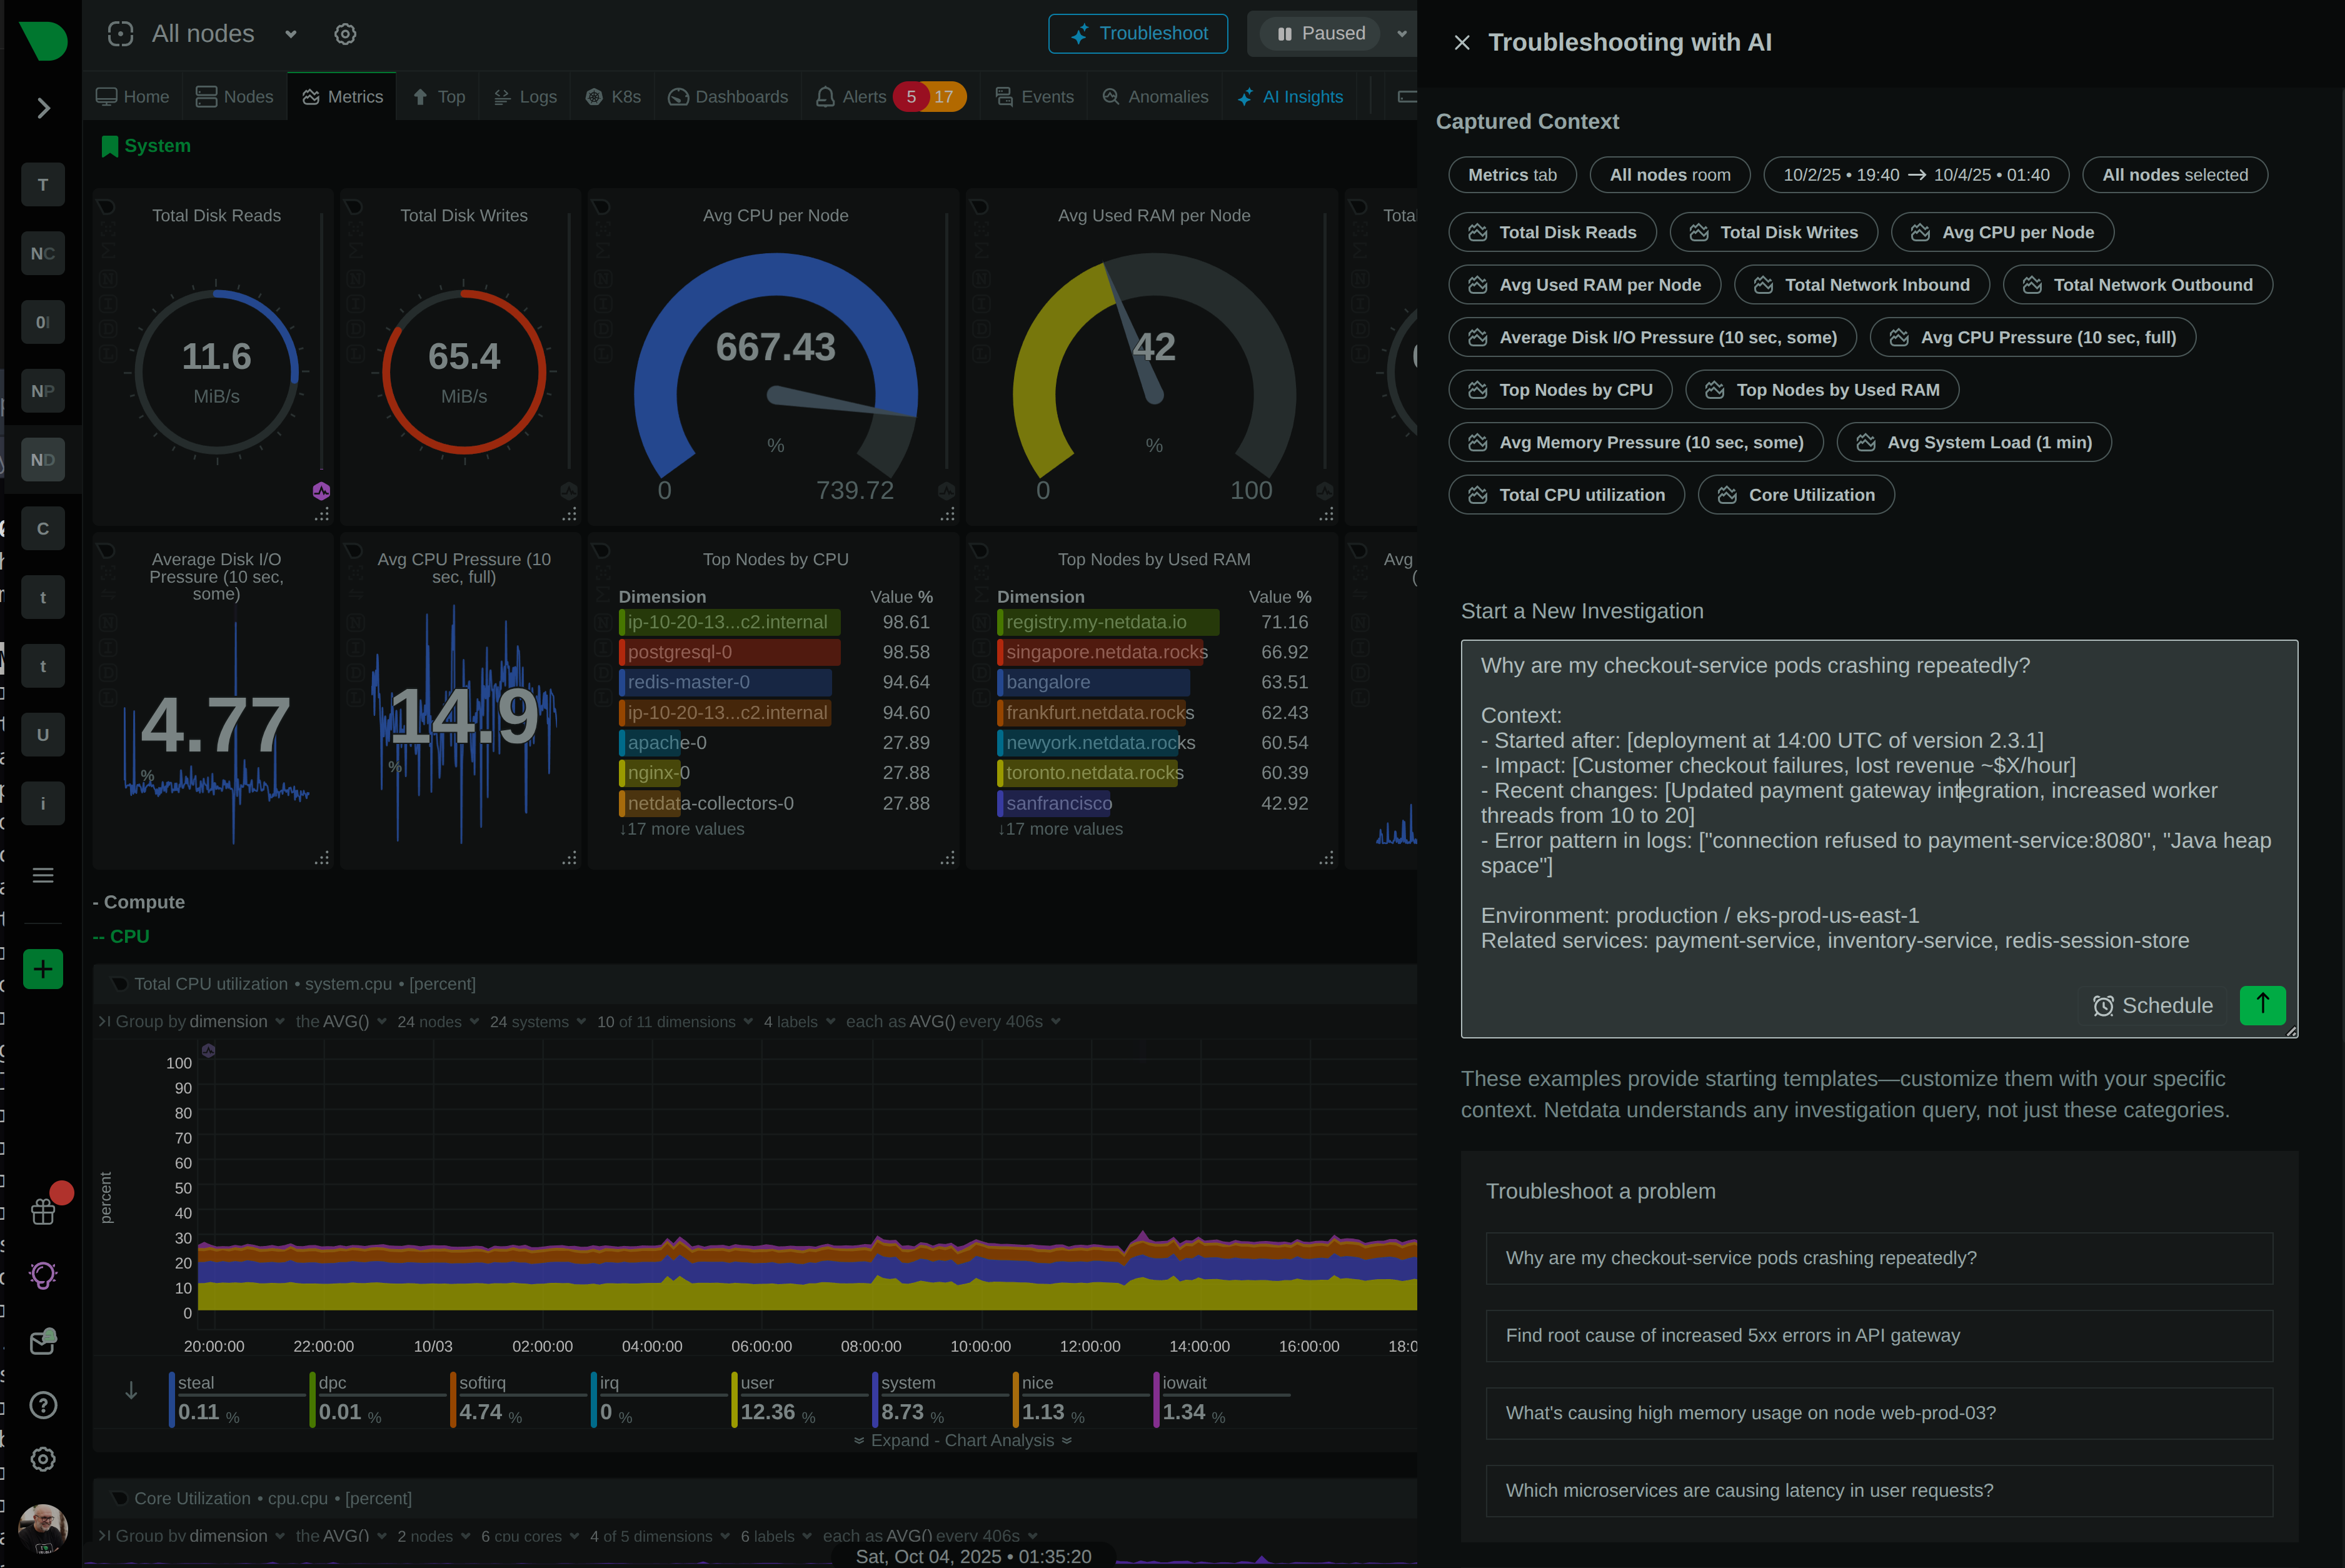
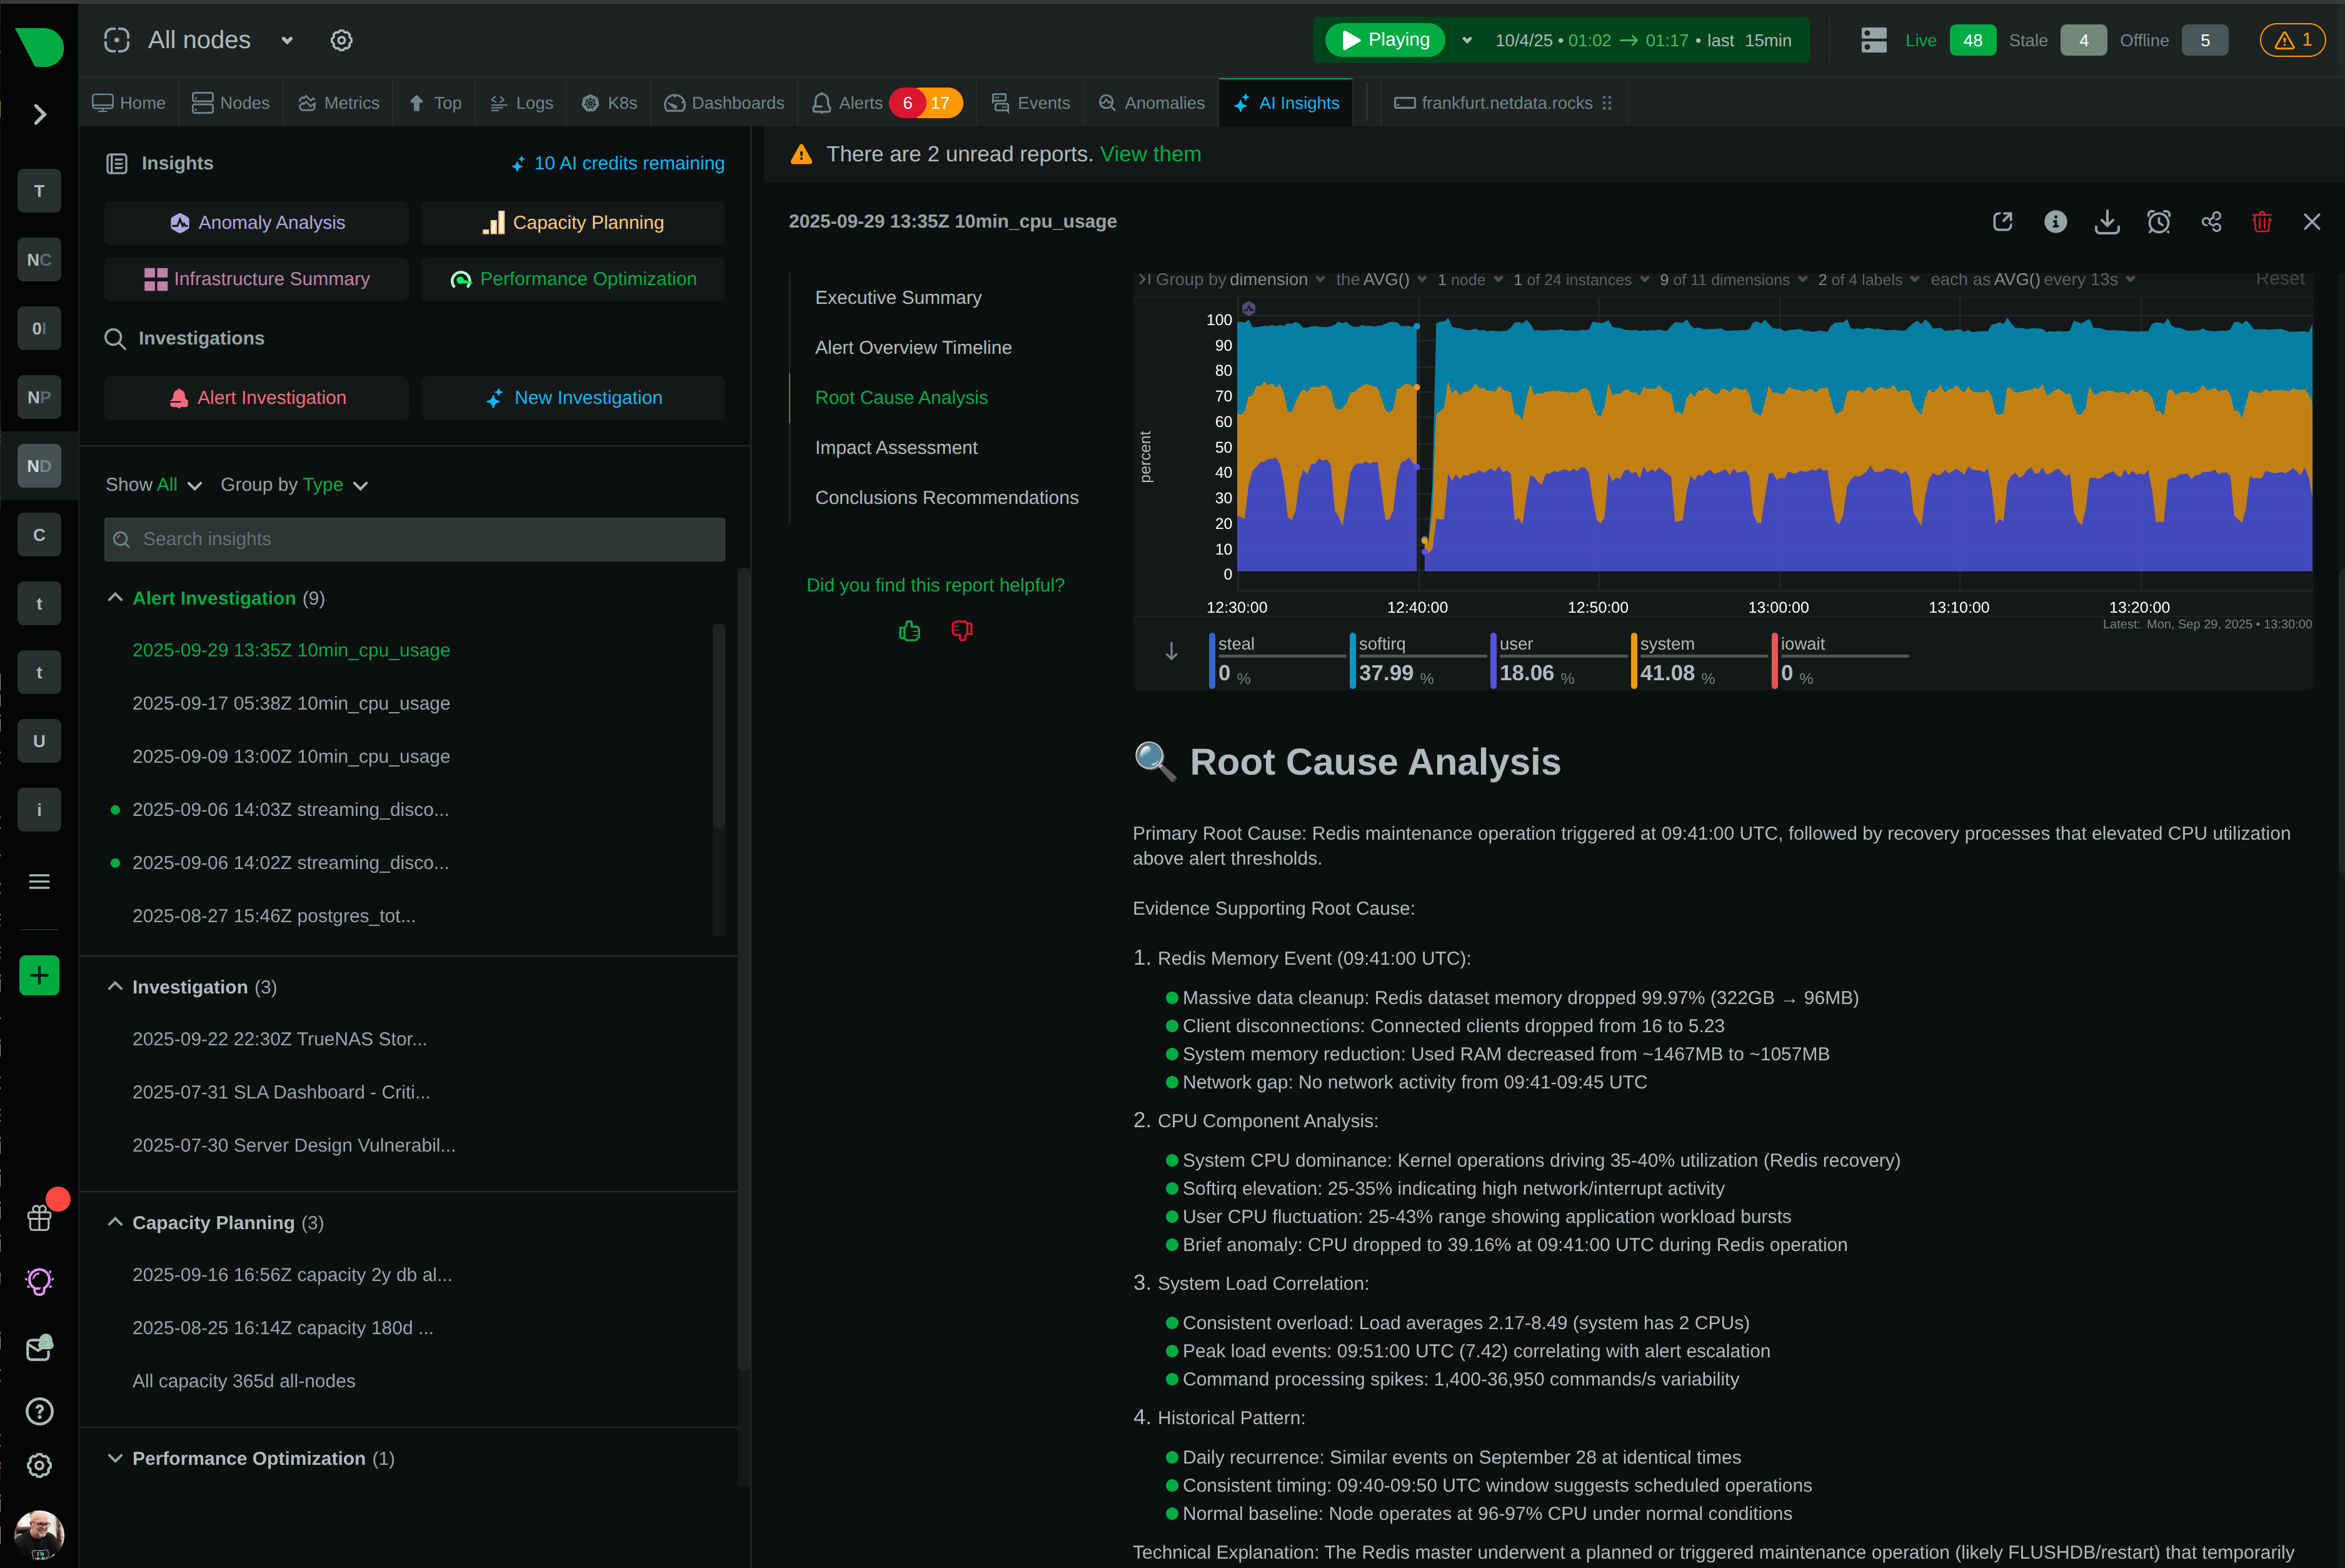
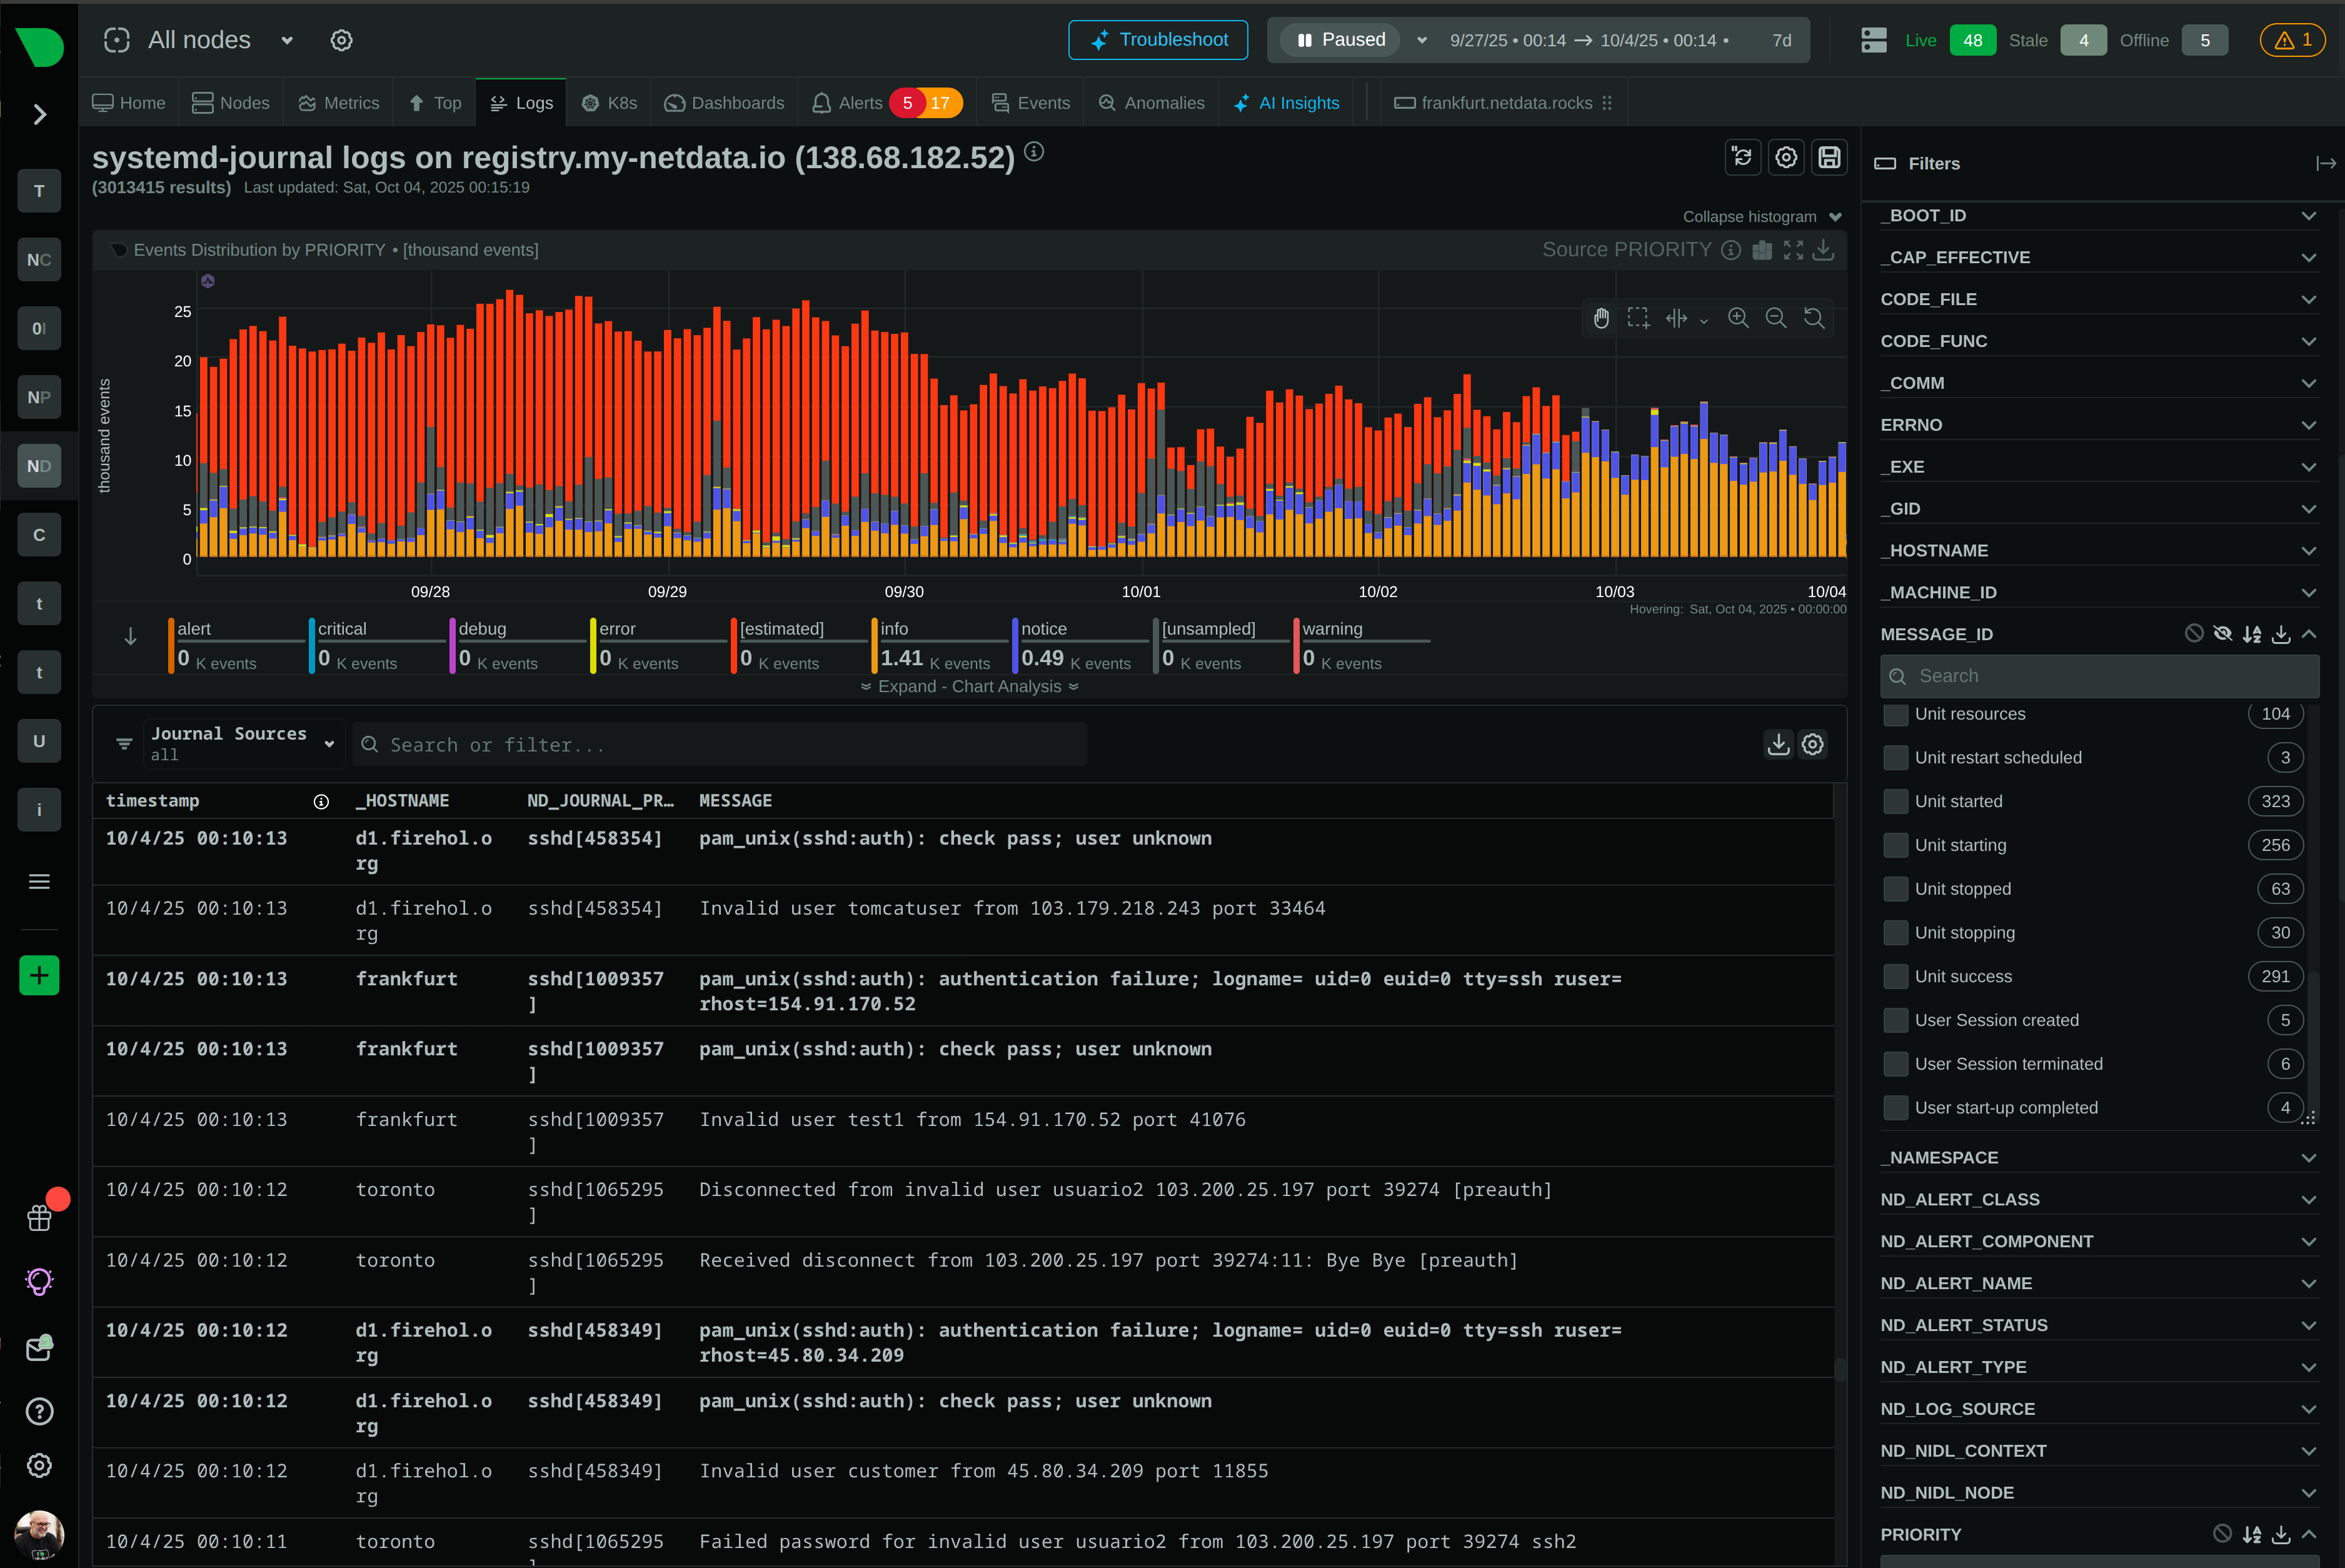
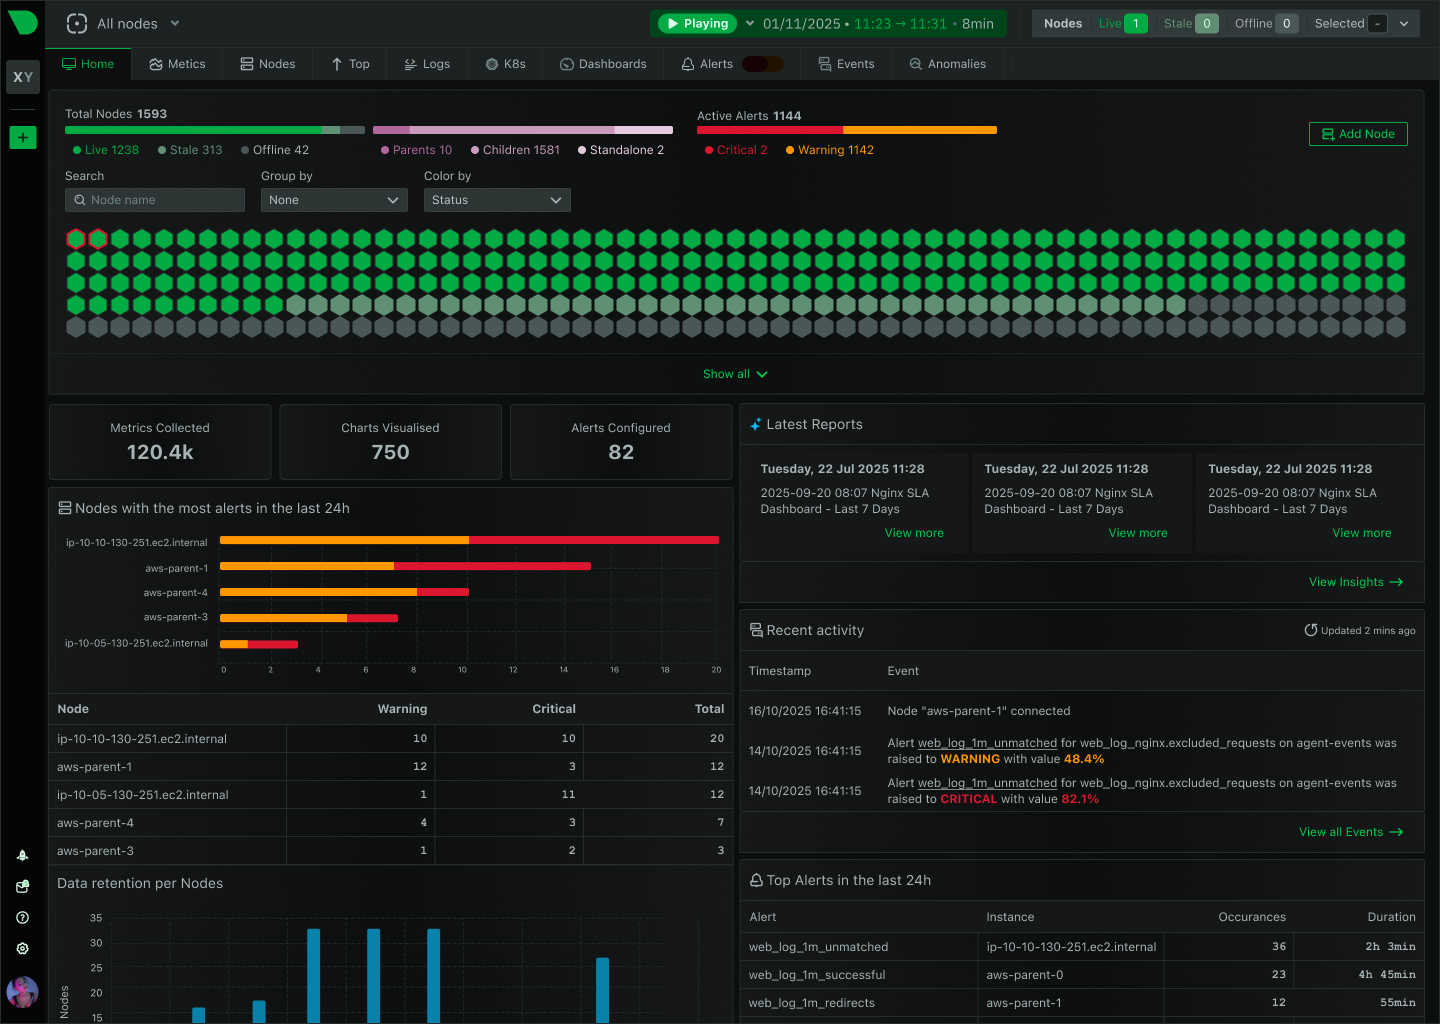
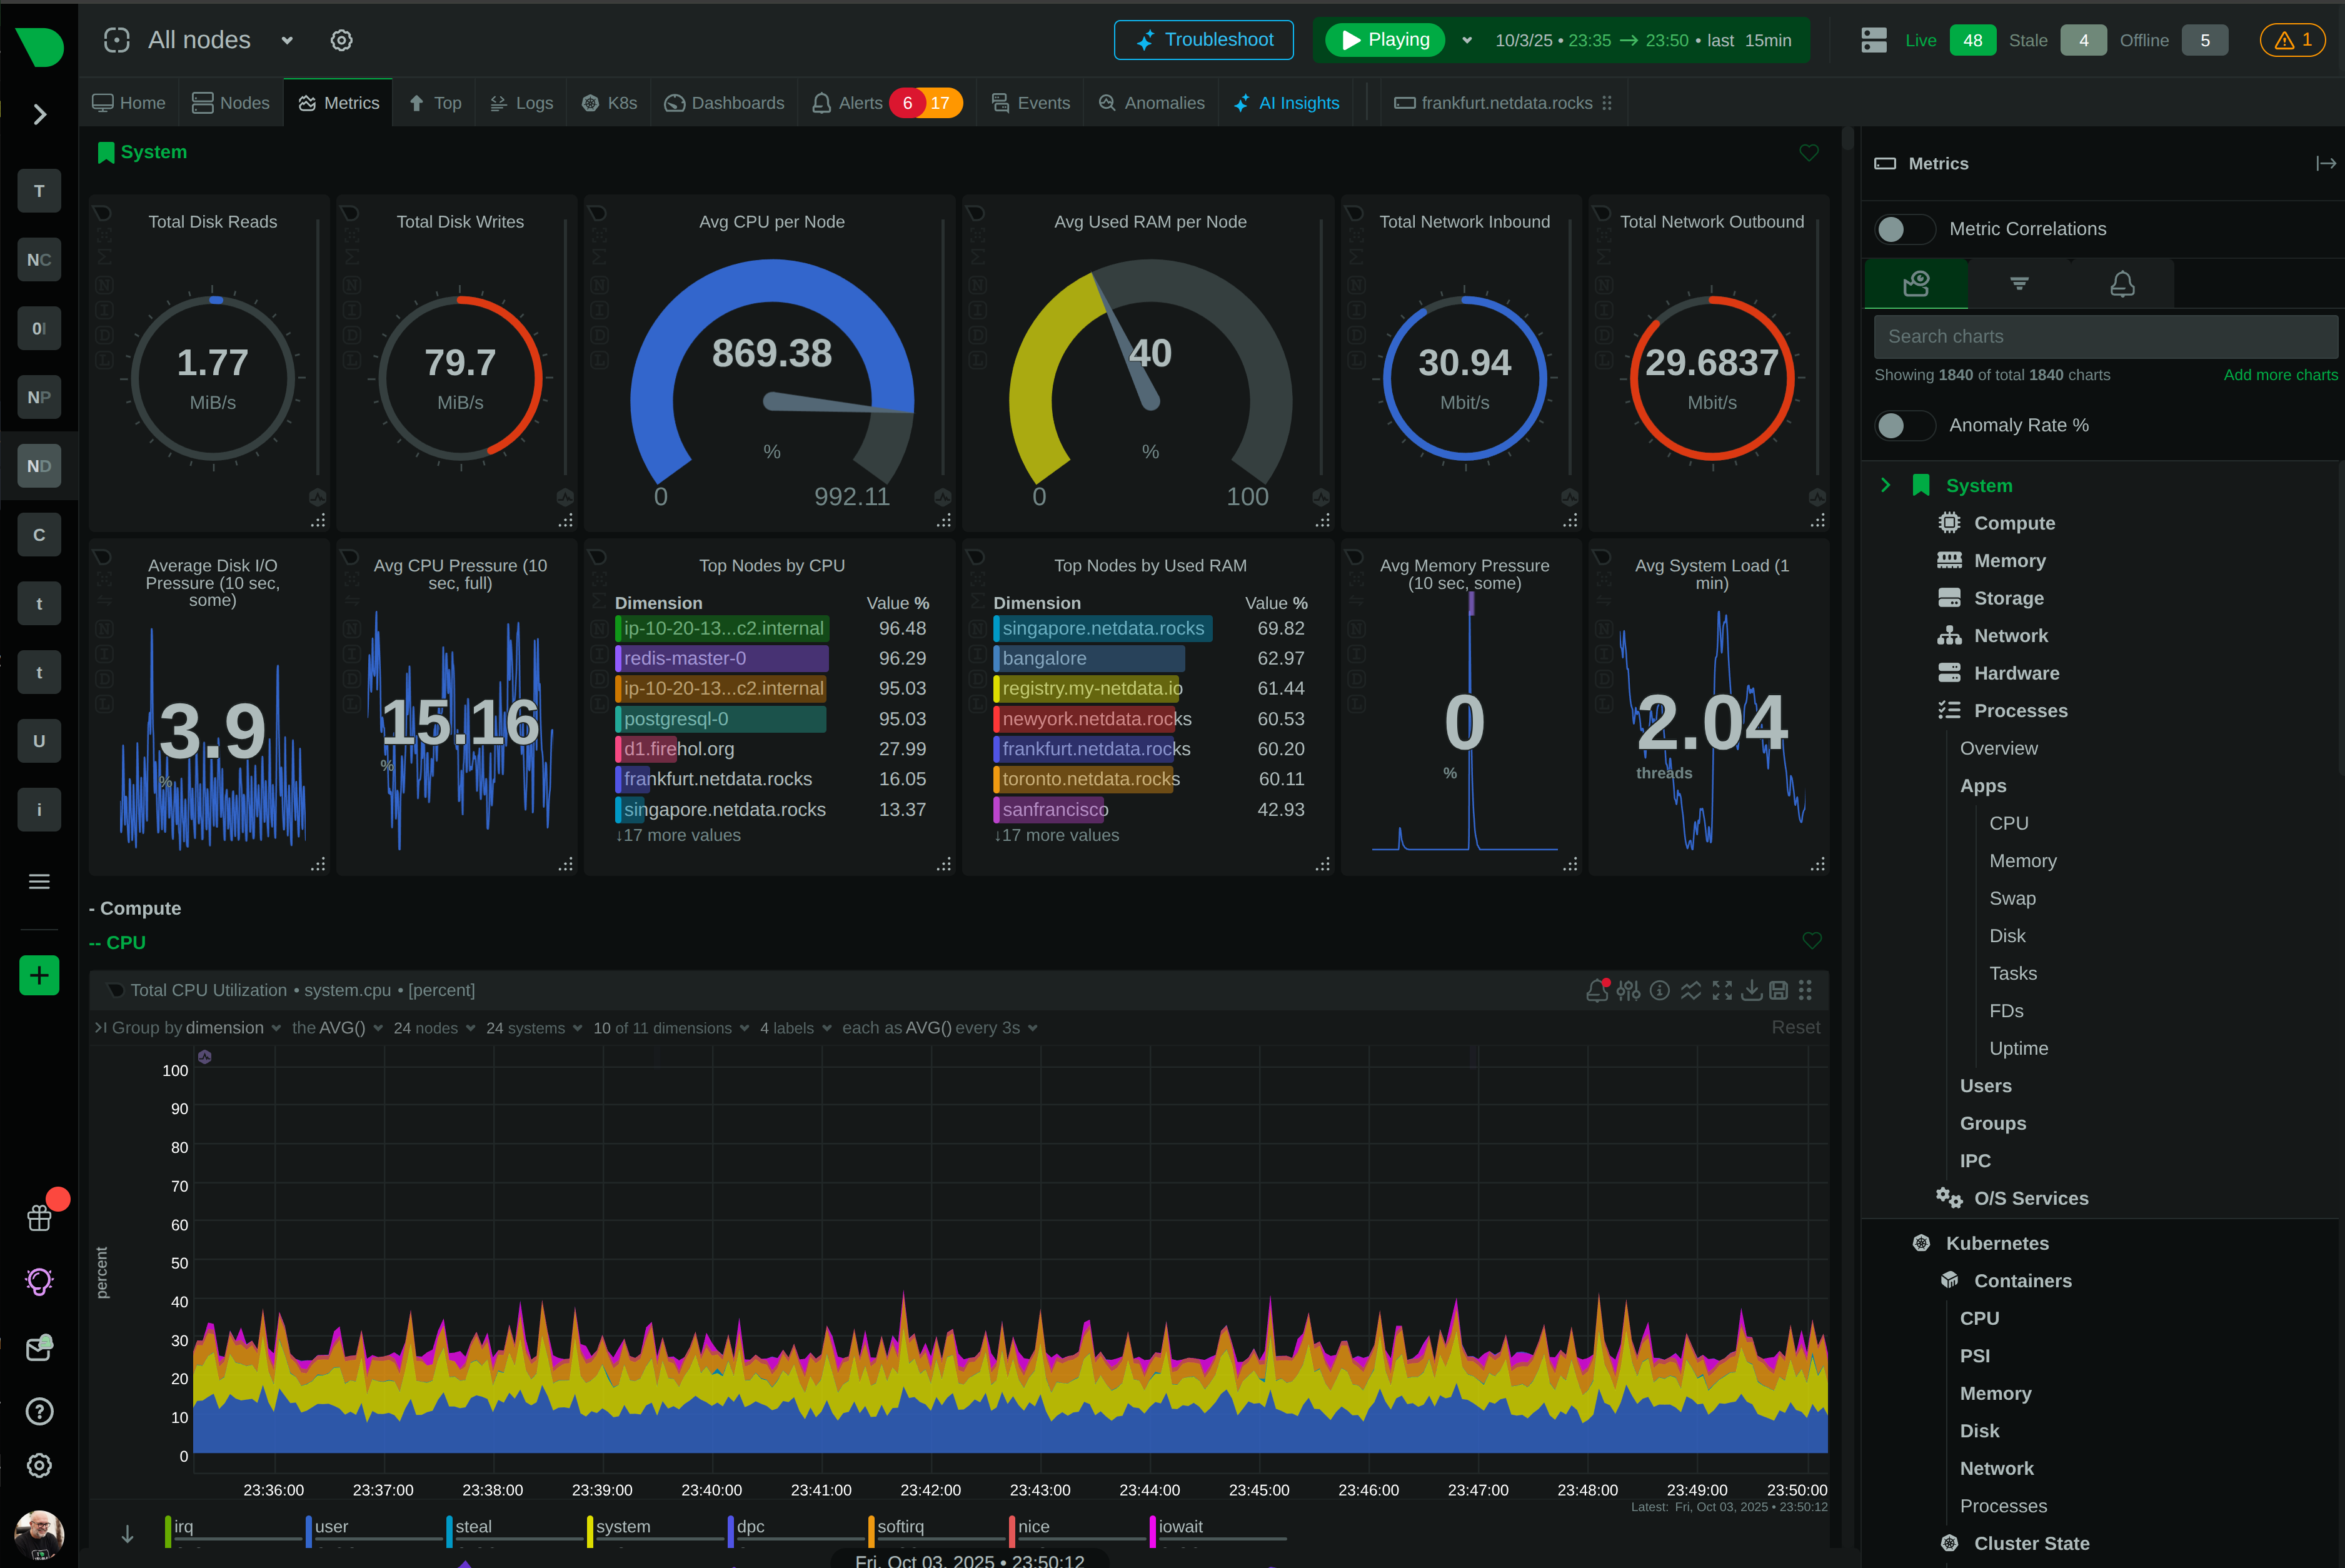
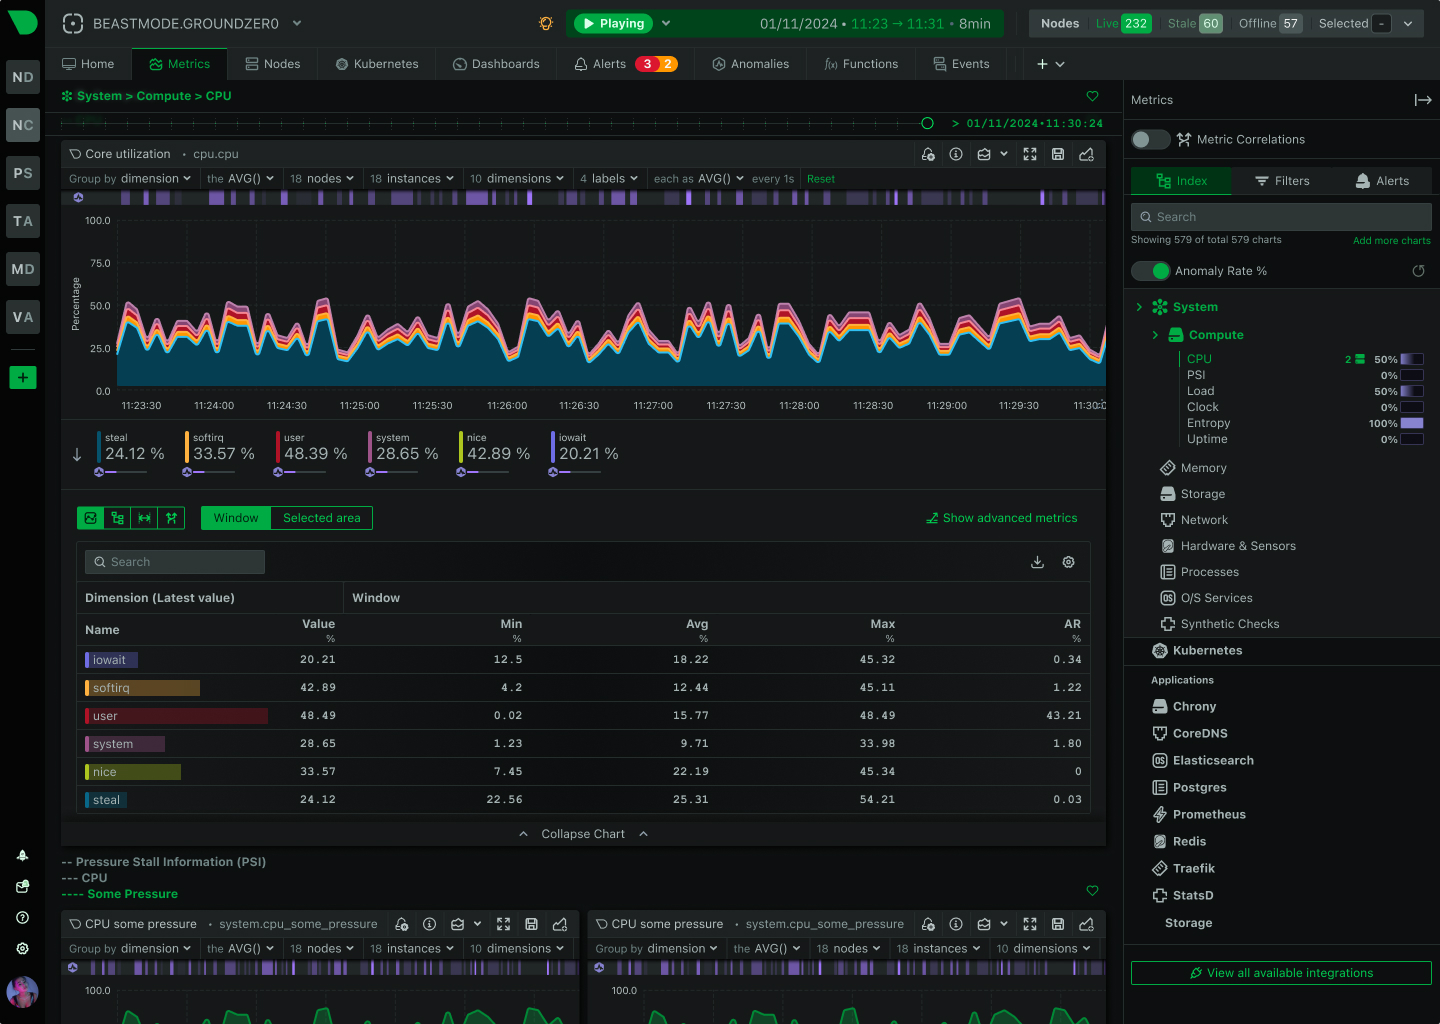
Ask Questions in Your Language, Get Answers From Your Infrastructure

Built-in MCP server on every Netdata Agent and Parent. Real-time metrics, ML anomaly detection, logs, and live system state - all accessible to AI assistants in natural language. Zero configuration. Complete data sovereignty. The fastest path from AI question to infrastructure answer.

Background Hero

Transform Every Team Member Into a Troubleshooting Expert

Built-in MCP server eliminates the gap between question and answer

Instant AI Access

Built-in MCP server on every Agent and Parent - no external installation, no configuration complexity, works with Claude, Cursor, ChatGPT, Gemini, VS Code

ML-Powered Context

18 models per metric detect anomalies in real-time - AI assistants see which metrics are abnormal, not just their values

Complete Visibility

MCP tools expose metrics, logs, alerts, live processes, network connections, systemd services - comprehensive infrastructure context in every conversation

Data Sovereignty

Edge-native architecture keeps observability data on-premises - AI queries run locally, no cloud egress, complete compliance confidence

Zero Configuration

From installation to AI-powered insights in 60 seconds - API key auto-generated, algorithmic dashboards provide semantic context automatically

Predictable Costs

Per-node pricing with unlimited MCP queries - no per-query charges, no data volume fees, encourage AI usage without cost anxiety

Trusted by DevOps teams worldwide

Give AI Assistants Expert-Level Infrastructure Knowledge

Eliminate Context Switching During Incidents

Ask questions in your IDE, terminal, or chat without opening dashboards. AI assistants access real-time metrics, ML anomaly detection, complete logs, and live system state - all in natural language. Reduce MTTR by 80% through instant root cause analysis with complete infrastructure context.

80% MTTR Reduction

See AI Troubleshooting

Eliminate Context Switching During Incidents

Detect Problems Before They Cascade

AI assistants see anomalies the moment they happen - not minutes later. 18 ML models per metric train continuously, detecting abnormal behavior with 99% false positive reduction. Anomaly rates embedded in every sample enable AI to distinguish normal from abnormal without manual threshold tuning.

99% False Positive Reduction

Explore ML Capabilities

Detect Problems Before They Cascade

Replace SSH With AI Conversations

Debug production without logging into servers. AI assistants access live processes, network connections, systemd services, Windows events - same per-second precision as console tools, but with history and ML context. Eliminate security risks from SSH access while improving troubleshooting speed.

Console-Level Access

View Live Functions

Replace SSH With AI Conversations

Query Millions of Log Entries Instantly

AI assistants access logs where they live - no Elasticsearch, no Splunk, no pipelines. Direct systemd-journal and Windows Event Log access analyzes 1M entries before sampling versus 5K for traditional tools. Correlate logs with metrics automatically for complete incident context.

200× Query Accuracy

Learn About Logs

Query Millions of Log Entries Instantly

Scale From One Node to 100,000 Without Changes

Same MCP interface works on single-node Agents, multi-node Parents, and infrastructure-wide via Netdata Cloud. AI assistants query 100,000 nodes as easily as one - distributed queries provide horizontal scalability without architectural complexity.

Linear Scalability

Understand Architecture

Scale From One Node to 100,000 Without Changes

Maintain Complete Control Over Your Data

Edge-native MCP servers keep observability data on-premises - AI queries run locally without cloud egress. Read-only access model ensures AI can query but not modify infrastructure. SOC 2 Type 2 certified with complete audit trail for compliance confidence.

Zero Data Egress

Review Security Design

Maintain Complete Control Over Your Data

Built-In vs Bolt-On MCP Integration

Why Netdata’s MCP Implementation Stands Apart

Most monitoring tools bolt MCP onto existing architectures. Netdata ships with MCP built in from day one - eliminating integration complexity, configuration overhead, and external dependencies.

Capability

Netdata MCP

Traditional Monitoring

MCP Server Deployment

✅ Built-In
Every Agent and Parent includes MCP server

⚠️ External Installation
Requires separate MCP server deployment and maintenance

Configuration Required

✅ Zero Configuration
API key auto-generated on first startup

⚠️ Extensive Setup
Configuration files, endpoint mapping, authentication setup

ML Anomaly Detection

✅ Ideal
18 models per metric, embedded in samples

❌ Not Available
AI sees values without anomaly context

Data Granularity

✅ Real-Time
Per-second collection with sub-2-second latency

⚠️ Near Real-Time
10-60 second intervals with additional lag

Logs Access

✅ Included
Direct systemd-journal and Windows Event Log access

❌ Not Available
Requires separate log management tools

Console Functions

✅ Advanced
Live processes, network connections, services accessible

❌ Not Available
Monitoring only, no console replacement

Data Location

✅ On-Premises
Edge-native architecture, zero egress costs

⚠️ Cloud-Centric
Data centralized in vendor cloud

Pricing Model

✅ Included
Per-node flat rate, unlimited queries

⚠️ Expensive
Data volume charges plus feature fees

Production Status

✅ Production-Ready
Fully supported since v2.6.0

⚠️ Limited
Preview, beta, or community-only support

Compare Netdata to Traditional Monitoring

MCP Tools Providing Complete Infrastructure Context

Discover and Query Any Metric

AI assistants automatically discover all nodes, metrics, instances, dimensions, and labels. Query time-series data with ML anomaly rates embedded in every sample.

Comprehensive MCP Tools

View All MCP Tools
Metrics Discovery Dashboard

Key Benefits of Netdata’s Built-In MCP Server

Transform infrastructure troubleshooting with AI assistants that understand your systems

Frequently Asked Questions