Choose Your AI Strategy Without Changing Your Monitoring
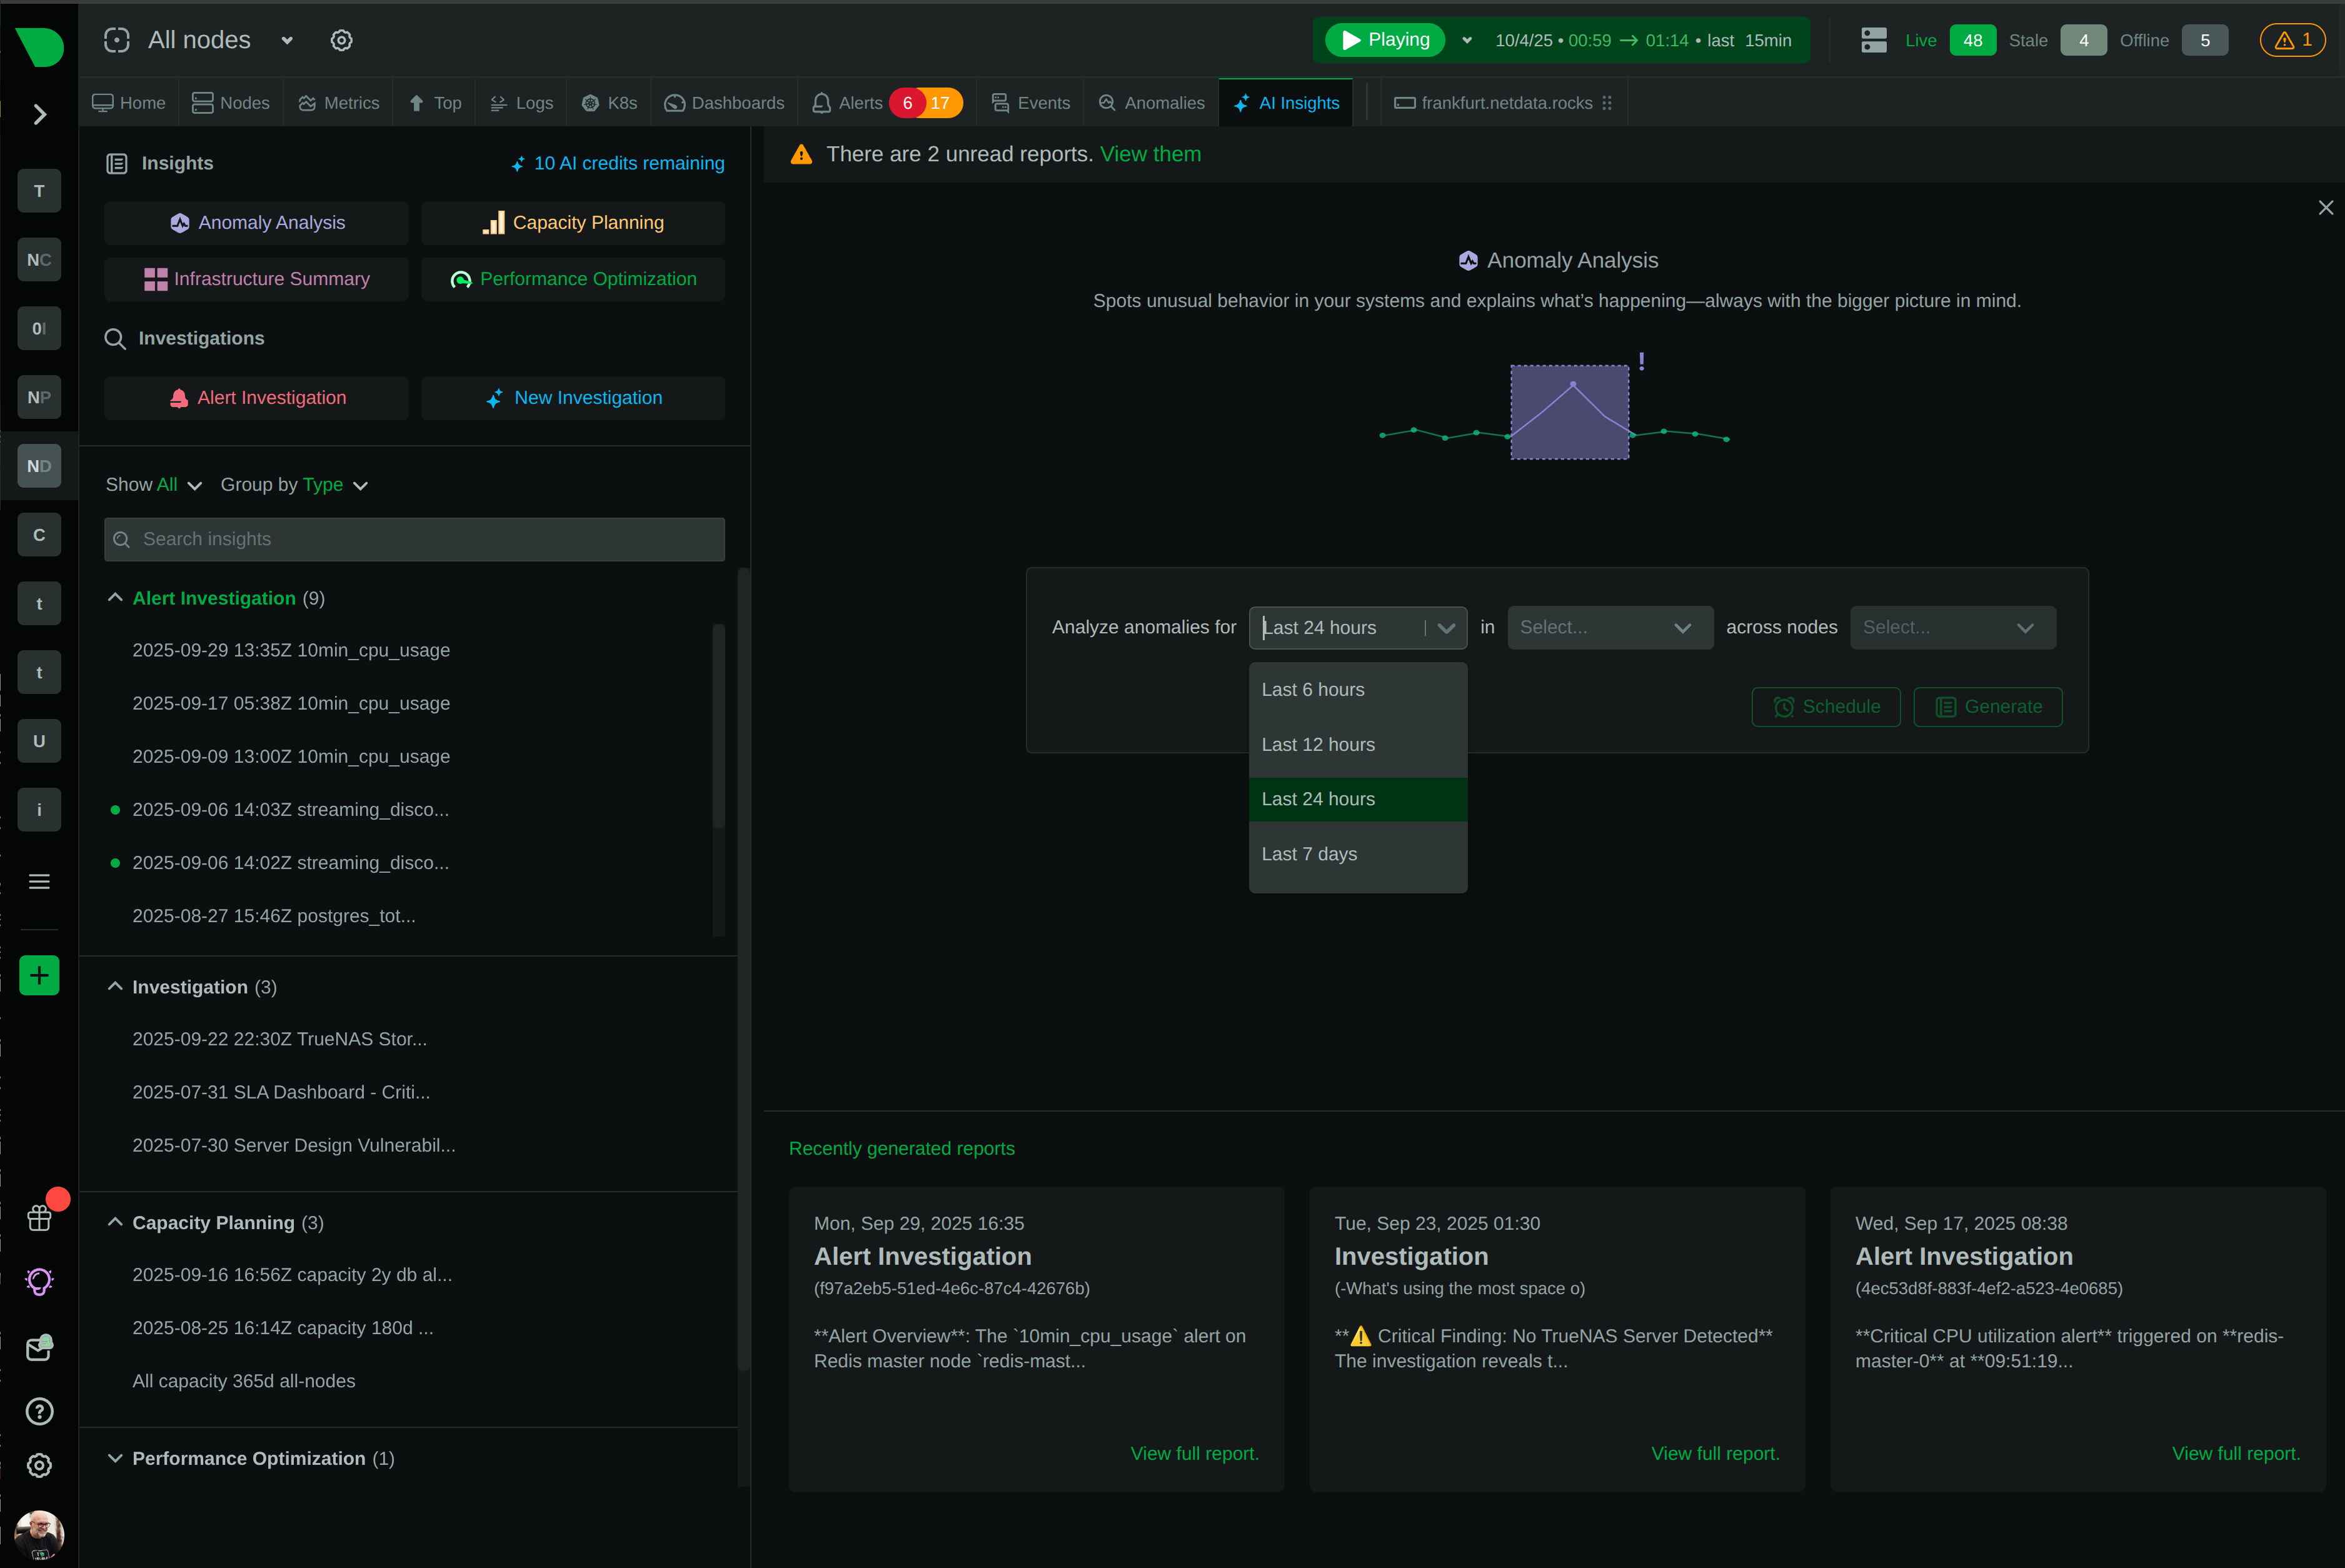
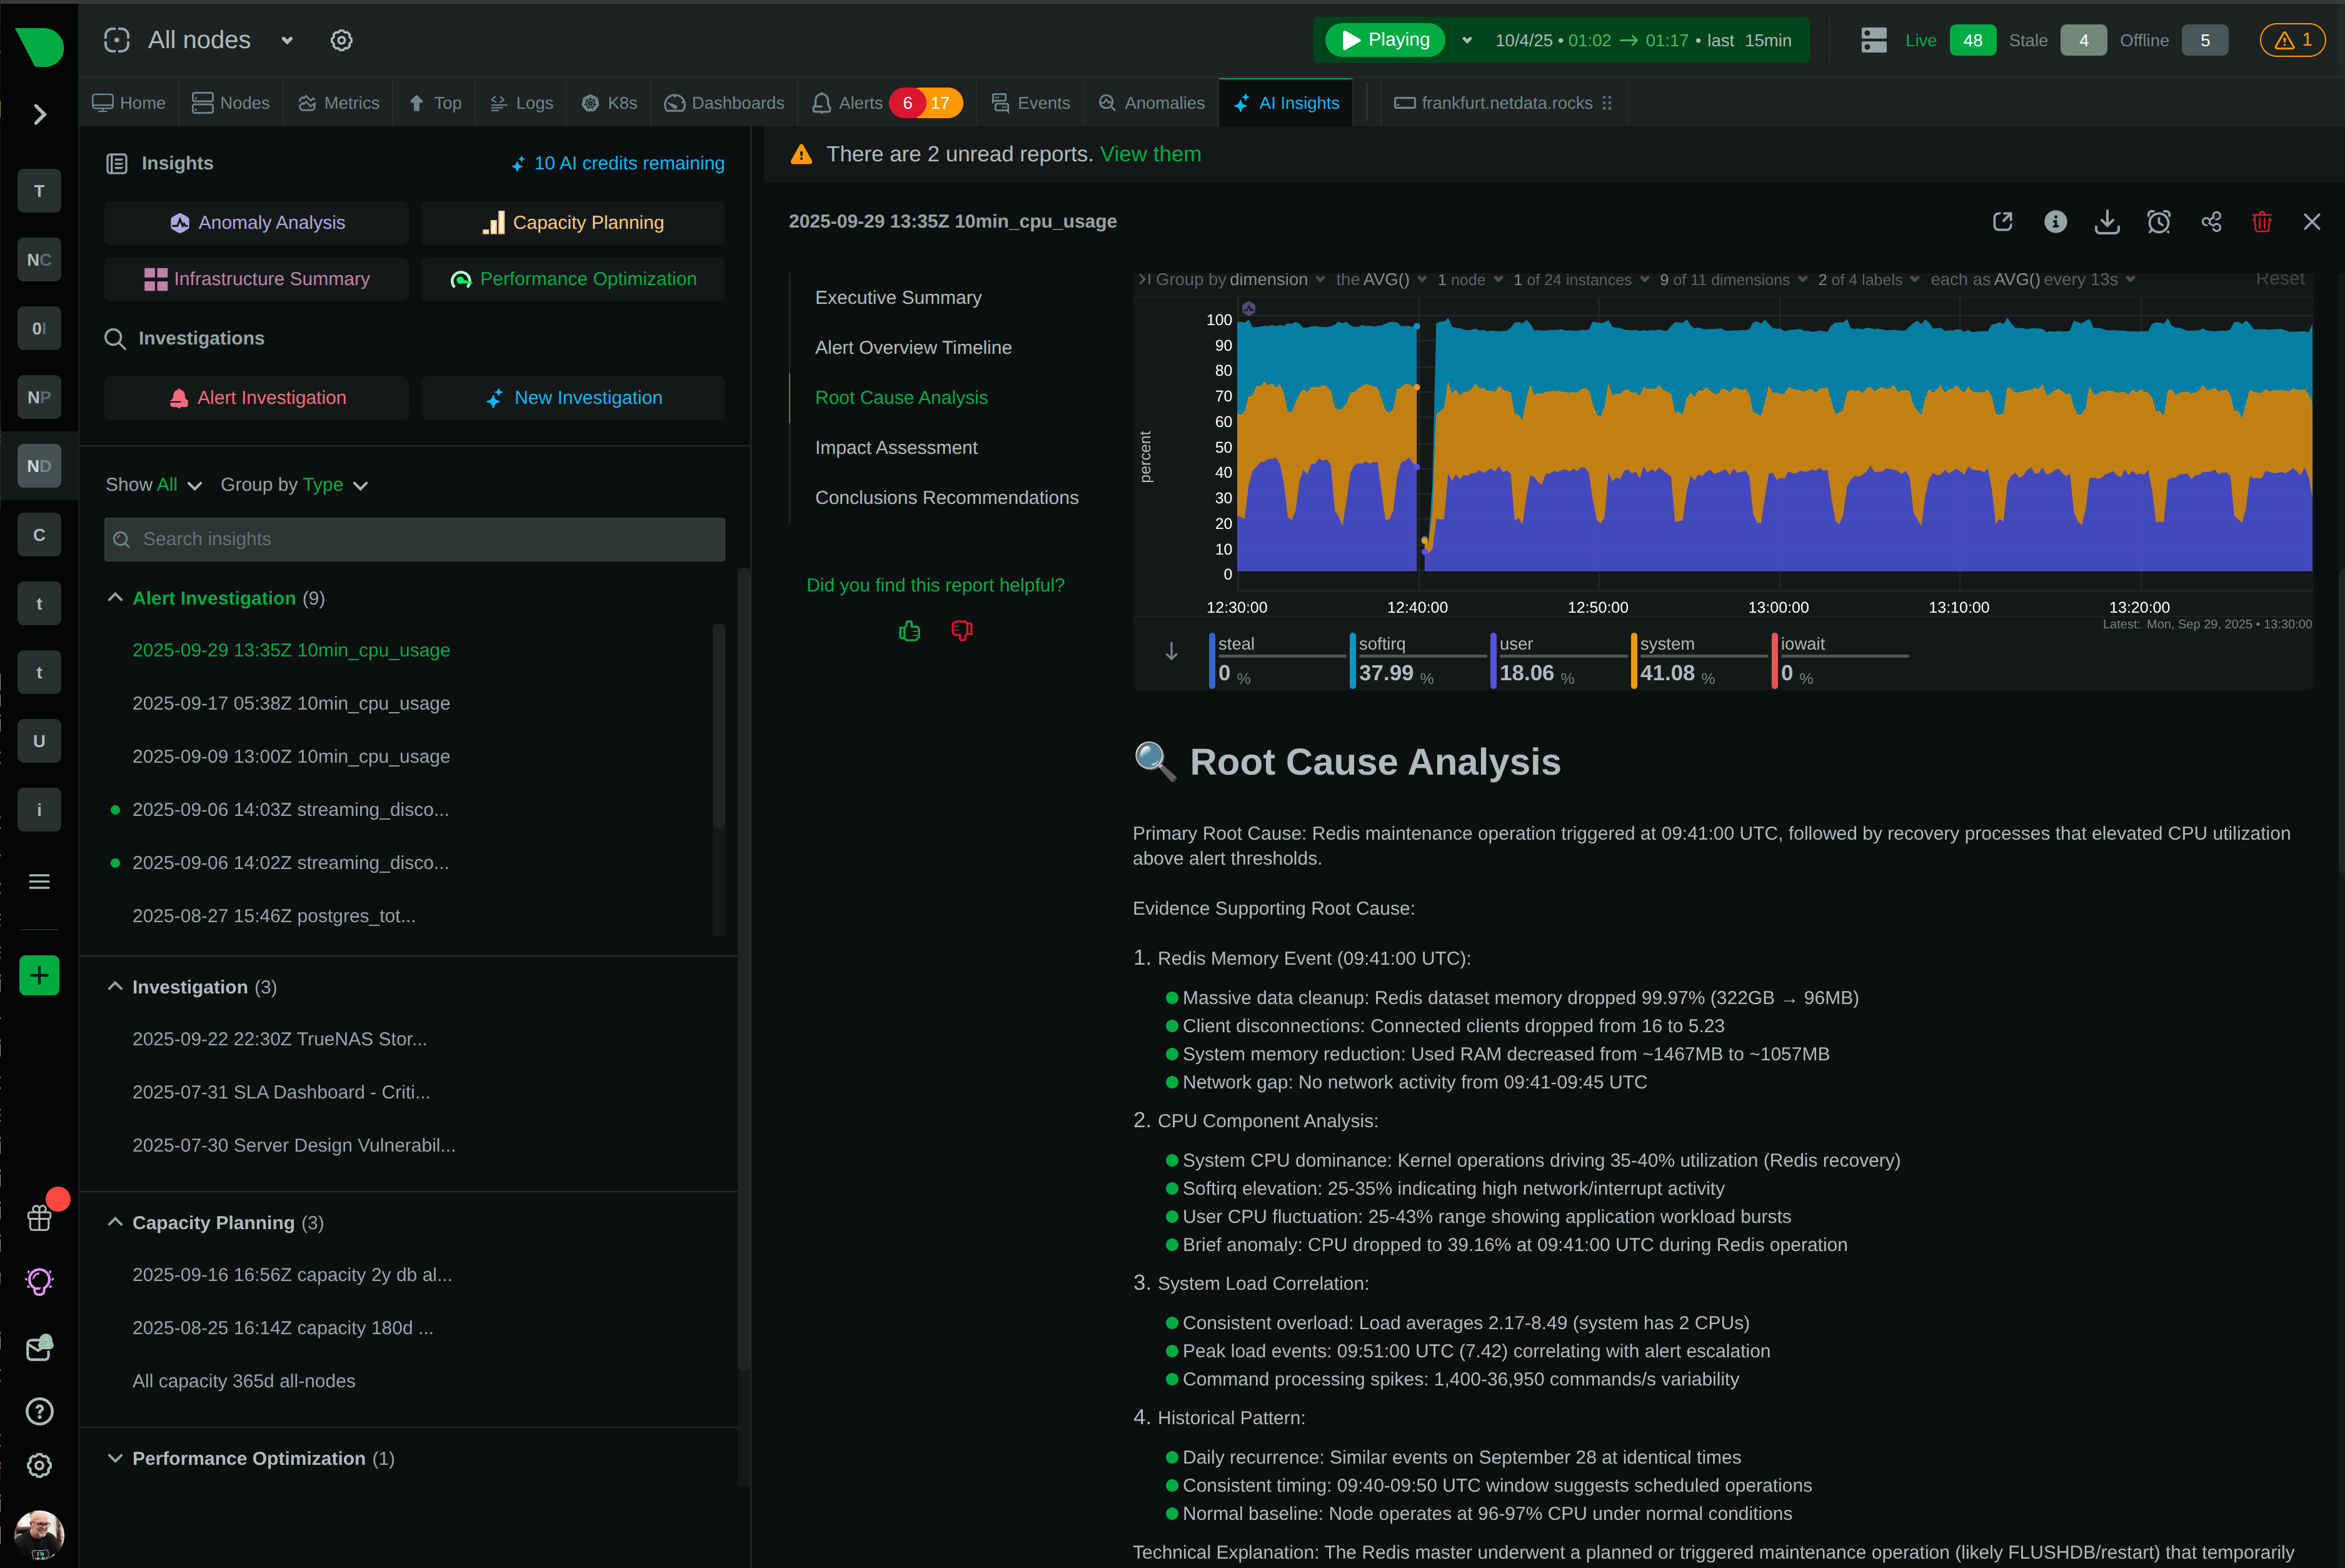
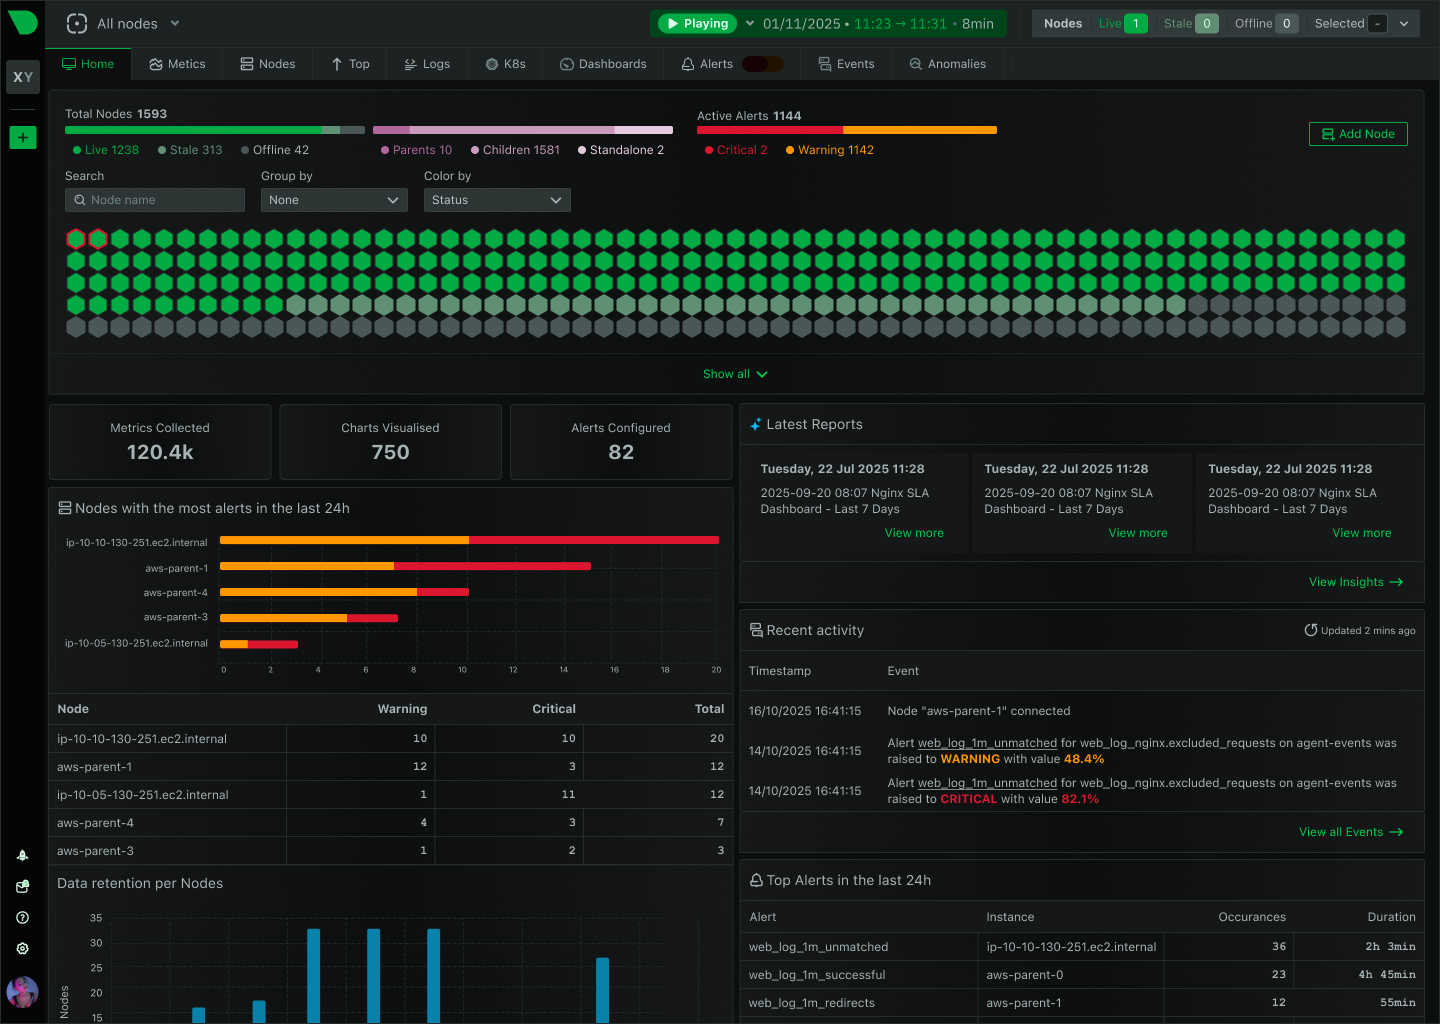
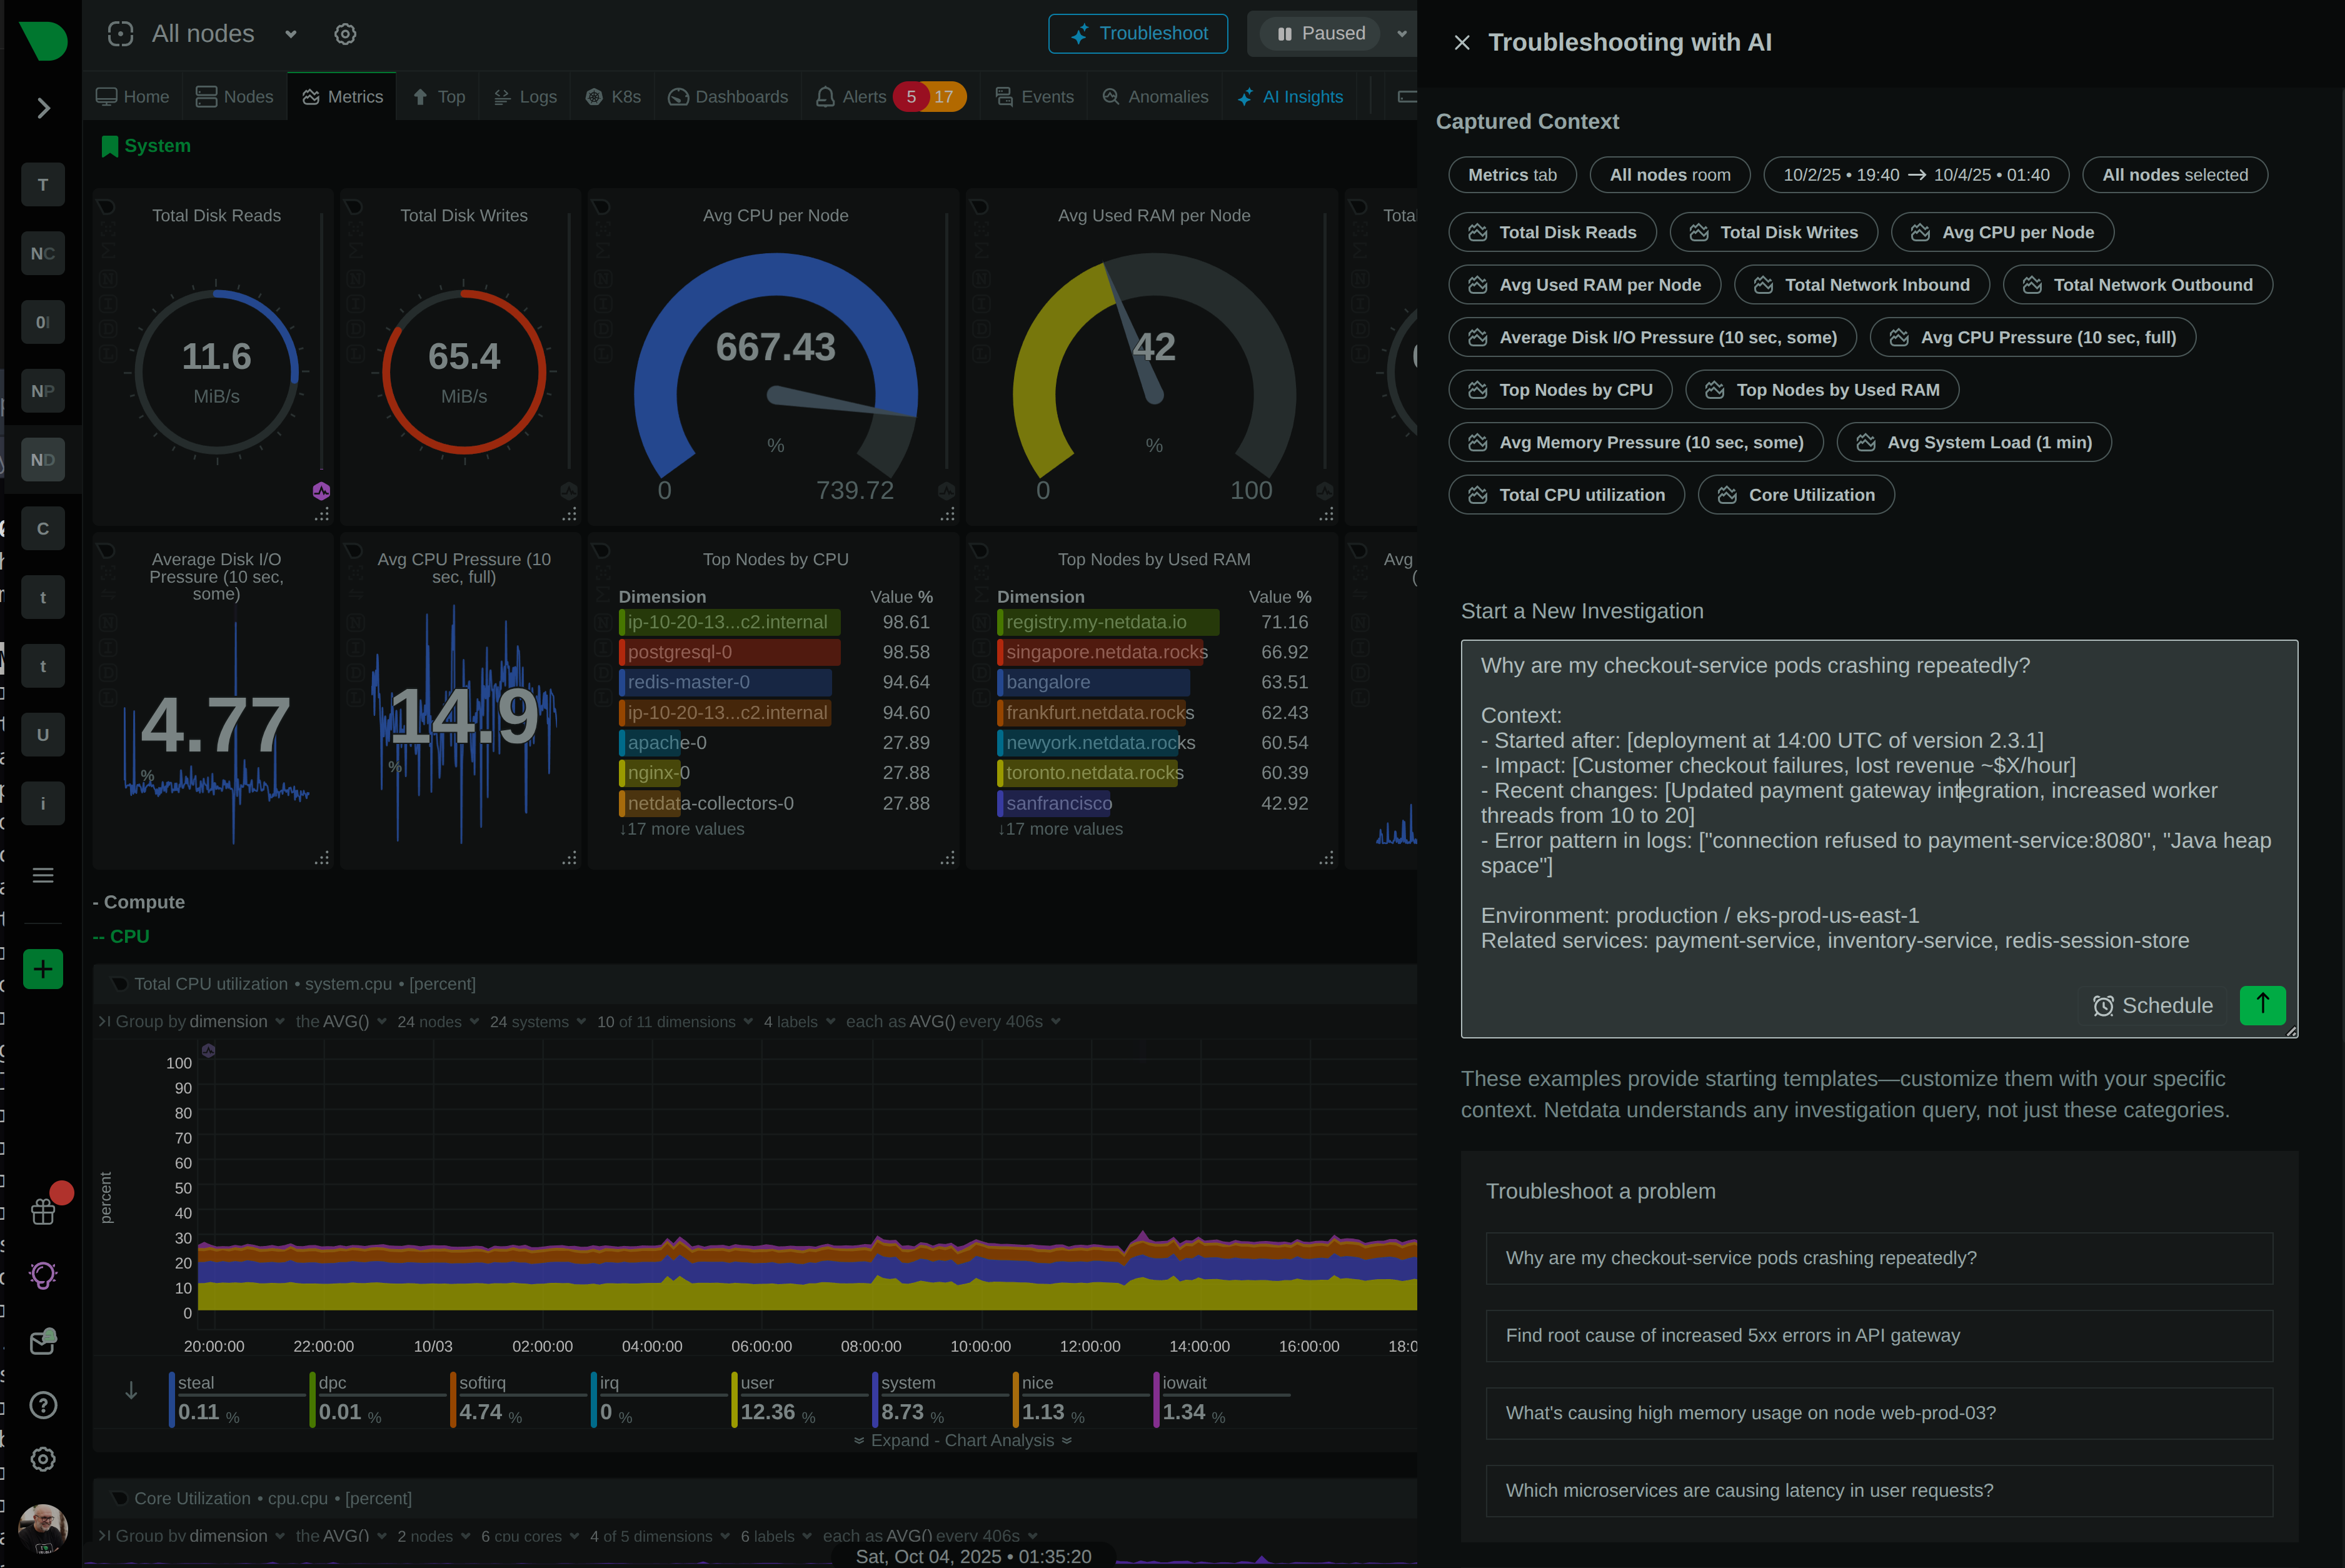
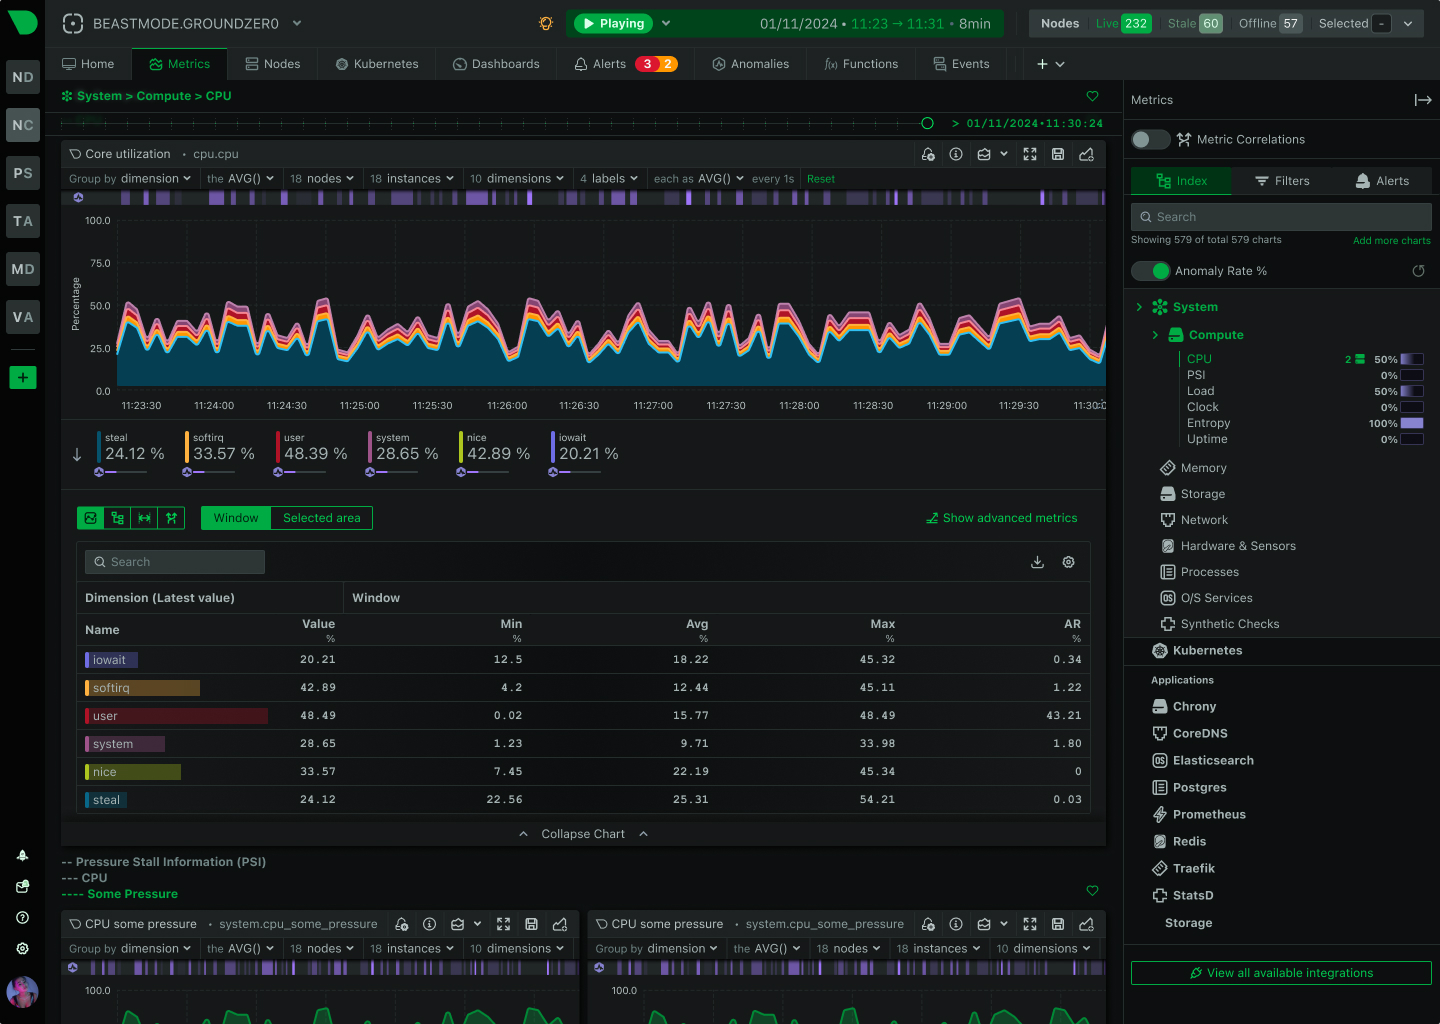
Netdata provides multiple AI integration paths: managed AI features via Netdata Cloud (optimized playbooks, 10 free sessions/month), bring-your-own-LLM via MCP through Netdata Cloud for infrastructure-wide access (Business/Homelab plan), or MCP directly on agents and parents for local access (free, open-source). MCP works with Claude, ChatGPT, Gemini, Cursor, VS Code, and any MCP-compatible client. This flexibility eliminates vendor lock-in while providing AI Insights reports (Infrastructure Summary, Capacity Planning, Performance Optimization, Anomaly Analysis) and interactive AI Troubleshoot capabilities throughout the dashboard.
2 AI integration paths
Discover MCP Integration