The only agent that thinks for itself

Autonomous Monitoring with self-learning AI built-in, operating independently across your entire stack.

Unlimited Metrics & Logs
Machine learning & MCP
5% CPU, 150MB RAM
3GB disk, >1 year retention
800+ integrations, zero config
Dashboards, alerts out of the box
> Discover Netdata Agents
Centralized metrics streaming and storage

Aggregate metrics from multiple agents into centralized Parent nodes for unified monitoring across your infrastructure.

Stream from unlimited agents
Long-term data retention
High availability clustering
Data replication & backup
Scalable architecture
Enterprise-grade security
> Learn about Parents
Fully managed cloud platform

Access your monitoring data from anywhere with our SaaS platform. No infrastructure to manage, automatic updates, and global availability.

Zero infrastructure management
99.9% uptime SLA
Global data centers
Automatic updates & patches
Enterprise SSO & RBAC
SOC2 & ISO certified
> Explore Netdata Cloud
Deploy Netdata Cloud in your infrastructure

Run the full Netdata Cloud platform on-premises for complete data sovereignty and compliance with your security policies.

Complete data sovereignty
Air-gapped deployment
Custom compliance controls
Private network integration
Dedicated support team
Kubernetes & Docker support
> Learn about Cloud On-Premises
Powerful, intuitive monitoring interface

Modern, responsive UI built for real-time troubleshooting with customizable dashboards and advanced visualization capabilities.

Real-time chart updates
Customizable dashboards
Dark & light themes
Advanced filtering & search
Responsive on all devices
Collaboration features
> Explore Netdata UI
Monitor on the go

Native iOS and Android apps bring full monitoring capabilities to your mobile device with real-time alerts and notifications.

iOS & Android apps
Push notifications
Touch-optimized interface
Offline data access
Biometric authentication
Widget support
> Download apps

Best energy efficiency

True real-time per-second

100% automated zero config

Centralized observability

Multi-year retention

High availability built-in

Zero maintenance

Always up-to-date

Enterprise security

Complete data control

Air-gap ready

Compliance certified

Millisecond responsiveness

Infinite zoom & pan

Works on any device

Native performance

Instant alerts

Monitor anywhere

80% Faster Incident Resolution
AI-powered troubleshooting from detection, to root cause and blast radius identification, to reporting.
True Real-Time and Simple, even at Scale
Linearly and infinitely scalable full-stack observability, that can be deployed even mid-crisis.
90% Cost Reduction, Full Fidelity
Instead of centralizing the data, Netdata distributes the code, eliminating pipelines and complexity.
Control Without Surrender
SOC 2 Type 2 certified with every metric kept on your infrastructure.
Integrations

800+ collectors and notification channels, auto-discovered and ready out of the box.

800+ data collectors
Auto-discovery & zero config
Cloud, infra, app protocols
Notifications out of the box
> Explore integrations
Real Results
46% Cost Reduction

Reduced monitoring costs by 46% while cutting staff overhead by 67%.

— Leonardo Antunez, Codyas

Zero Pipeline

No data shipping. No central storage costs. Query at the edge.

From Our Users
"Out-of-the-Box"

So many out-of-the-box features! I mostly don't have to develop anything.

— Simon Beginn, LANCOM Systems

No Query Language

Point-and-click troubleshooting. No PromQL, no LogQL, no learning curve.

Enterprise Ready
67% Less Staff, 46% Cost Cut

Enterprise efficiency without enterprise complexity—real ROI from day one.

— Leonardo Antunez, Codyas

SOC 2 Type 2 Certified

Zero data egress. Only metadata reaches the cloud. Your metrics stay on your infrastructure.

Full Coverage
800+ Collectors

Auto-discovered and configured. No manual setup required.

Any Notification Channel

Slack, PagerDuty, Teams, email, webhooks—all built-in.

From Our Users
"A Rare Unicorn"

Netdata gives more than you invest in it. A rare unicorn that obeys the Pareto rule.

— Eduard Porquet Mateu, TMB Barcelona

99% Downtime Reduction

Reduced website downtime by 99% and cloud bill by 30% using Netdata alerts.

— Falkland Islands Government

Real Savings
30% Cloud Cost Reduction

Optimized resource allocation based on Netdata alerts cut cloud spending by 30%.

— Falkland Islands Government

46% Cost Cut

Reduced monitoring staff by 67% while cutting operational costs by 46%.

— Codyas

Real Coverage
"Plugin for Everything"

Netdata has agent capacity or a plugin for everything, including Windows and Kubernetes.

— Eduard Porquet Mateu, TMB Barcelona

"Out-of-the-Box"

So many out-of-the-box features! I mostly don't have to develop anything.

— Simon Beginn, LANCOM Systems

Real Speed
Troubleshooting in 30 Seconds

From 2-3 minutes to 30 seconds—instant visibility into any node issue.

— Matthew Artist, Nodecraft

20% Downtime Reduction

20% less downtime and 40% budget optimization from out-of-the-box monitoring.

— Simon Beginn, LANCOM Systems

Pay per Node. Unlimited Everything Else.

One price per node. Unlimited metrics, logs, users, and retention. No per-GB surprises.

Free tier—forever
No metric limits or caps
Retention you control
Cancel anytime
> See pricing plans
What's Your Monitoring Really Costing You?

Most teams overpay by 40-60%. Let's find out why.

Expose hidden metric charges
Calculate tool consolidation
Customers report 30-67% savings
Results in under 60 seconds
> See what you're really paying
Your Infrastructure Is Unique. Let's Talk.

Because monitoring 10 nodes is different from monitoring 10,000.

On-prem & air-gapped deployment
Volume pricing & agreements
Architecture review for your scale
Compliance & security support
> Start a conversation
Monitoring That Sells Itself

Deploy in minutes. Impress clients in hours. Earn recurring revenue for years.

30-second live demos close deals
Zero config = zero support burden
Competitive margins & deal protection
Response in 48 hours
> Apply to partner
Per-Second Metrics at Homelab Prices

Same engine, same dashboards, same ML. Just priced for tinkerers.

Community: Free forever · 5 nodes · non-commercial
Homelab: $90/yr · unlimited nodes · fair usage
> Start monitoring your lab—free
$1,000 Per Referral. Unlimited Referrals.

Your colleagues get 10% off. You get 10% commission. Everyone wins.

10% of subscriptions, up to $1,000 each
Track earnings inside Netdata Cloud
PayPal/Venmo payouts in 3-4 weeks
No caps, no complexity
> Get your referral link
Cost Proof
40% Budget Optimization

"Netdata's significant positive impact" — LANCOM Systems

Calculate Your Savings

Compare vs Datadog, Grafana, Dynatrace

Savings Proof
46% Cost Reduction

"Cut costs by 46%, staff by 67%" — Codyas

30% Cloud Bill Savings

"Reduced cloud bill by 30%" — Falkland Islands Gov

Enterprise Proof
"Better Than Combined Alternatives"

"Better observability with Netdata than combining other tools." — TMB Barcelona

Real Engineers, <24h Response

DPA, SLAs, on-prem, volume pricing

Why Partners Win
Demo Live Infrastructure

One command, 30 seconds, real data—no sandbox needed

Zero Tickets, High Margins

Auto-config + per-node pricing = predictable profit

Homelab Ready
"Absolutely Incredible"

"We tested every monitoring system under the sun." — Benjamin Gabler, CEO Rocket.Net

76k+ GitHub Stars

3rd most starred monitoring project

Worth Recommending
Product That Delivers

Customers report 40-67% cost cuts, 99% downtime reduction

Zero Risk to Your Rep

Free tier lets them try before they buy

Never Fight Fires Alone

Docs, community, and expert help—pick your path to resolution.

Learn.netdata.cloud docs
Discord, Forums, GitHub
Premium support available
> Get answers now
60 Seconds to First Dashboard

One command to install. Zero config. 850+ integrations documented.

Linux, Windows, K8s, Docker
Auto-discovers your stack
> Start monitoring now
See Netdata in Action

Watch real-time monitoring in action—demos, tutorials, and engineering deep dives.

Product demos and walkthroughs
Real infrastructure, not staged
> Start with the 3-minute tour
Level Up Your Monitoring
Real problems. Real solutions. 112+ guides from basic monitoring to AI observability.
76,000+ Engineers Strong
615+ contributors. 1.5M daily downloads. One mission: simplify observability.
Per-Second. 90% Cheaper. Data Stays Home.
Side-by-side comparisons: costs, real-time granularity, and data sovereignty for every major tool.

See why teams switch from Datadog, Prometheus, Grafana, and more.

> Browse all comparisons
Edge-Native Observability, Born Open Source
Per-second visibility, ML on every metric, and data that never leaves your infrastructure.
Founded in 2016
615+ contributors worldwide
Remote-first, engineering-driven
Open source first
> Read our story
Promises We Publish—and Prove
12 principles backed by open code, independent validation, and measurable outcomes.
Open source, peer-reviewed
Zero config, instant value
Data sovereignty by design
Aligned pricing, no surprises
> See all 12 principles
Edge-Native, AI-Ready, 100% Open
76k+ stars. Full ML, AI, and automation—GPLv3+, not premium add-ons.
76,000+ GitHub stars
GPLv3+ licensed forever
ML on every metric, included
Zero vendor lock-in
> Explore our open source
Build Real-Time Observability for the World
Remote-first team shipping per-second monitoring with ML on every metric.
Remote-first, fully distributed
Open source (76k+ stars)
Challenging technical problems
Your code on millions of systems
> See open roles
Talk to a Netdata Human in <24 Hours
Sales, partnerships, press, or professional services—real engineers, fast answers.
Discuss your observability needs
Pricing and volume discounts
Partnership opportunities
Media and press inquiries
> Book a conversation
Your Data. Your Rules.
On-prem data, cloud control plane, transparent terms.
Trust & Scale
76,000+ GitHub Stars

One of the most popular open-source monitoring projects

SOC 2 Type 2 Certified

Enterprise-grade security and compliance

Data Sovereignty

Your metrics stay on your infrastructure

Validated
University of Amsterdam

"Most energy-efficient monitoring solution" — ICSOC 2023, peer-reviewed

ADASTEC (Autonomous Driving)

"Doesn't miss alerts—mission-critical trust for safety software"

Community Stats
615+ Contributors

Global community improving monitoring for everyone

1.5M+ Downloads/Day

Trusted by teams worldwide

GPLv3+ Licensed

Free forever, fully open source agent

Why Join?
Remote-First

Work from anywhere, async-friendly culture

Impact at Scale

Your work helps millions of systems

Compliance
SOC 2 Type 2

Audited security controls

GDPR Ready

Data stays on your infrastructure

Netdata vs Azure Monitor

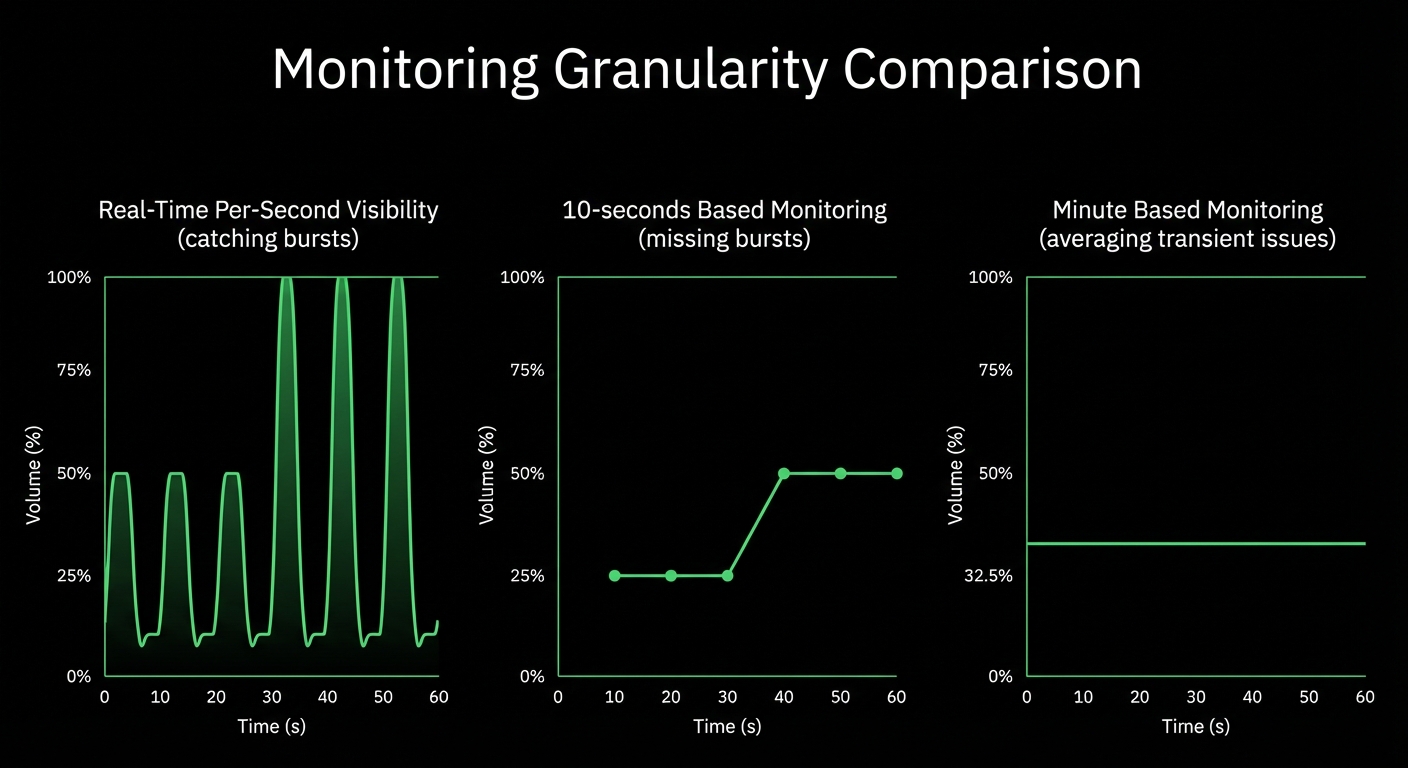
See What Azure Monitor’s 1-Minute Intervals Completely Miss

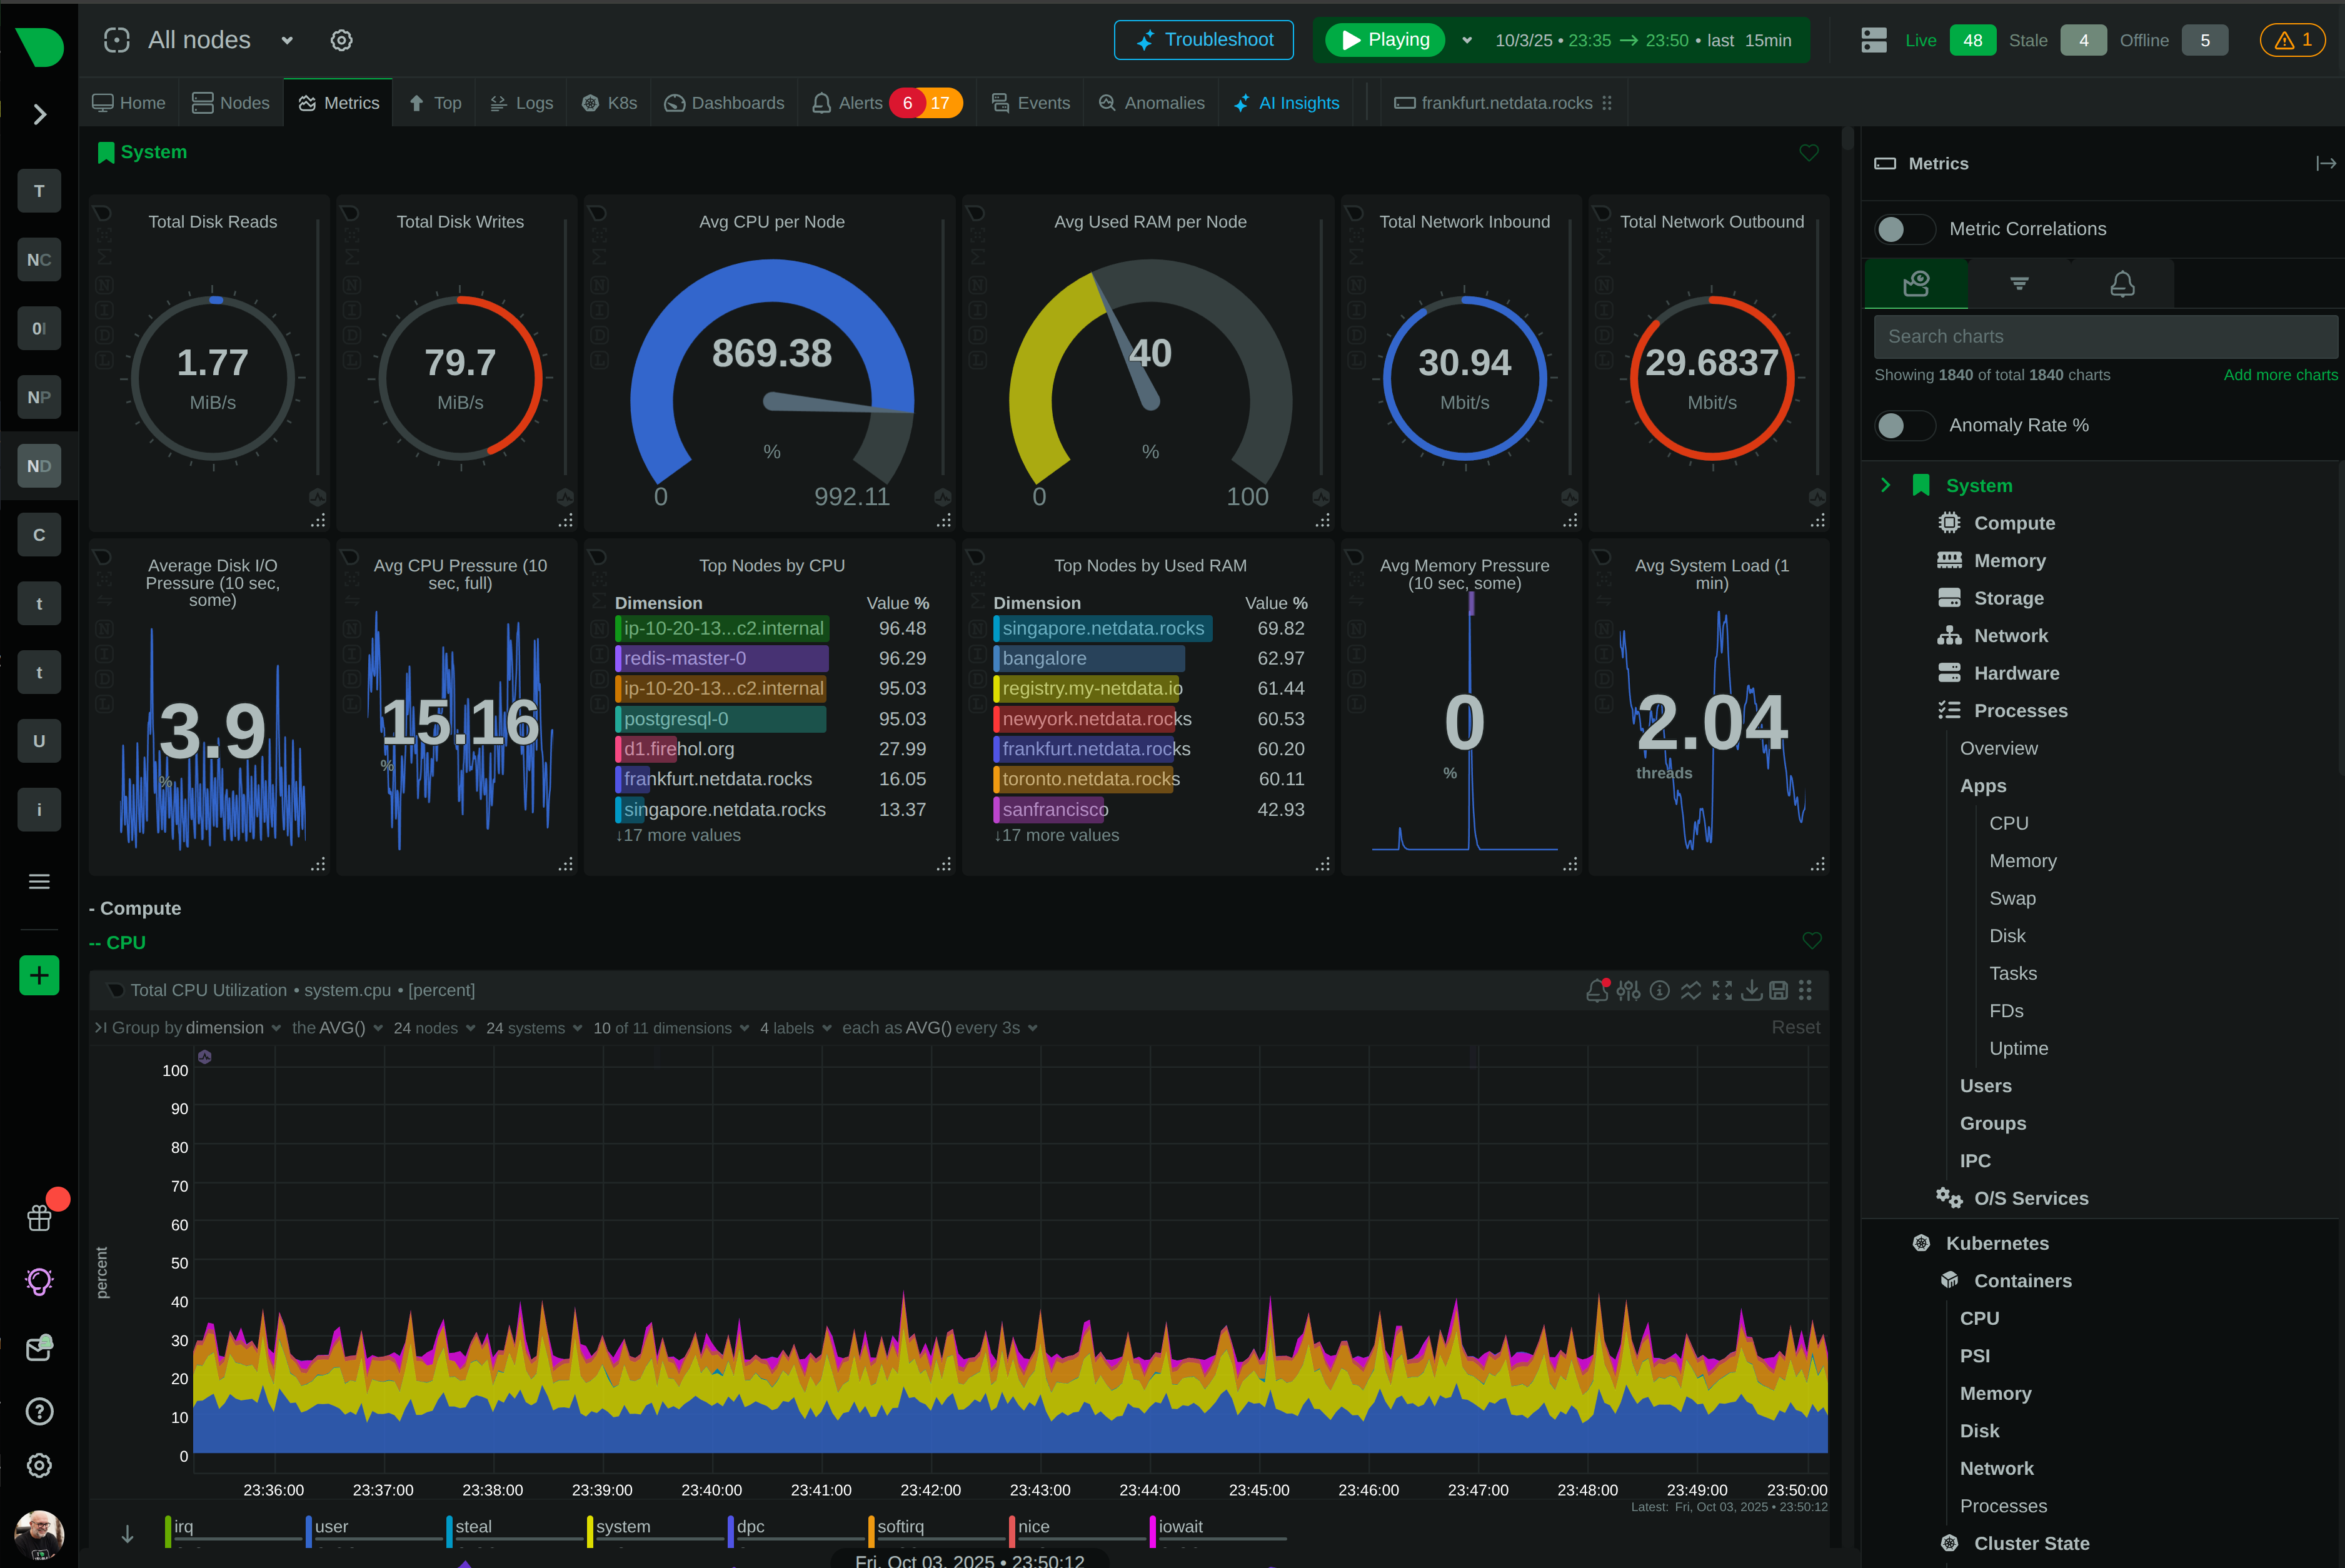
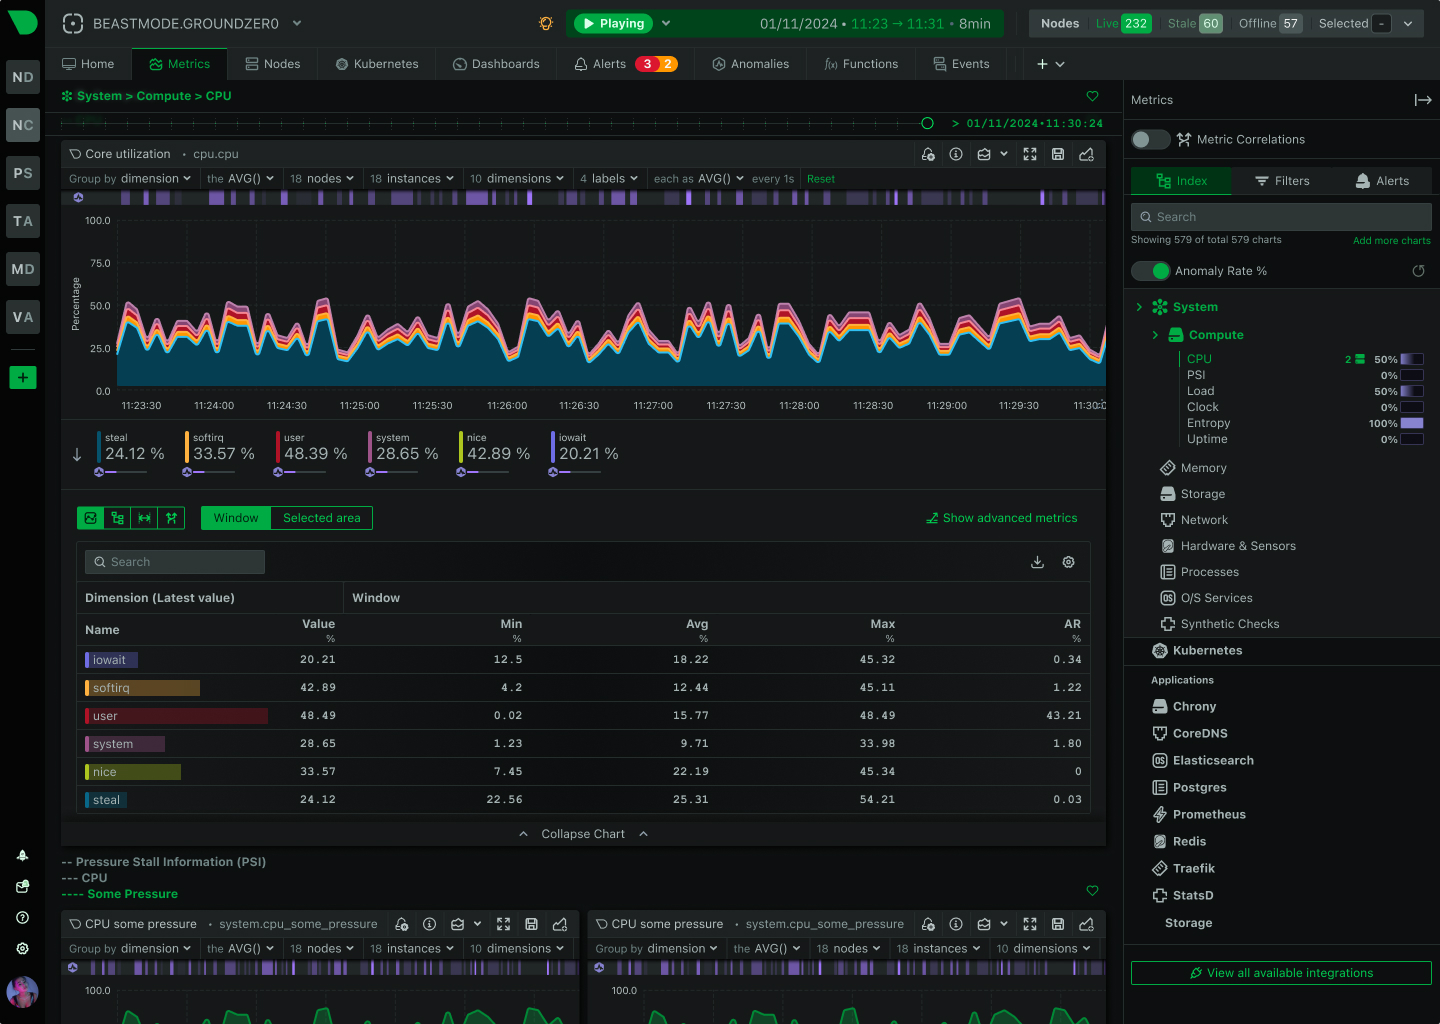
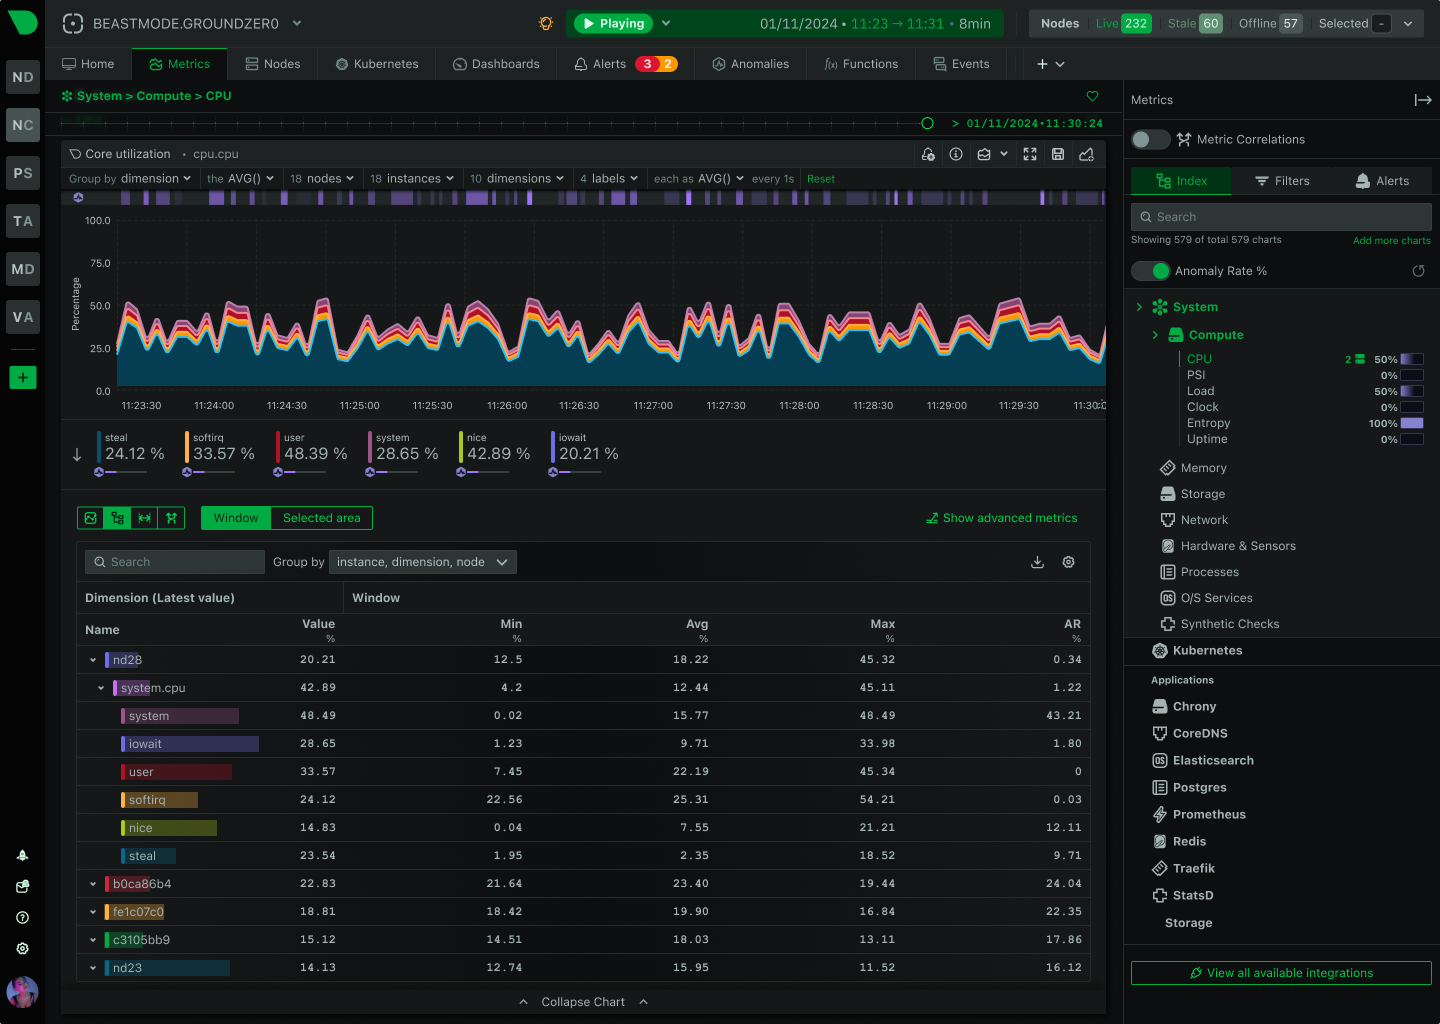
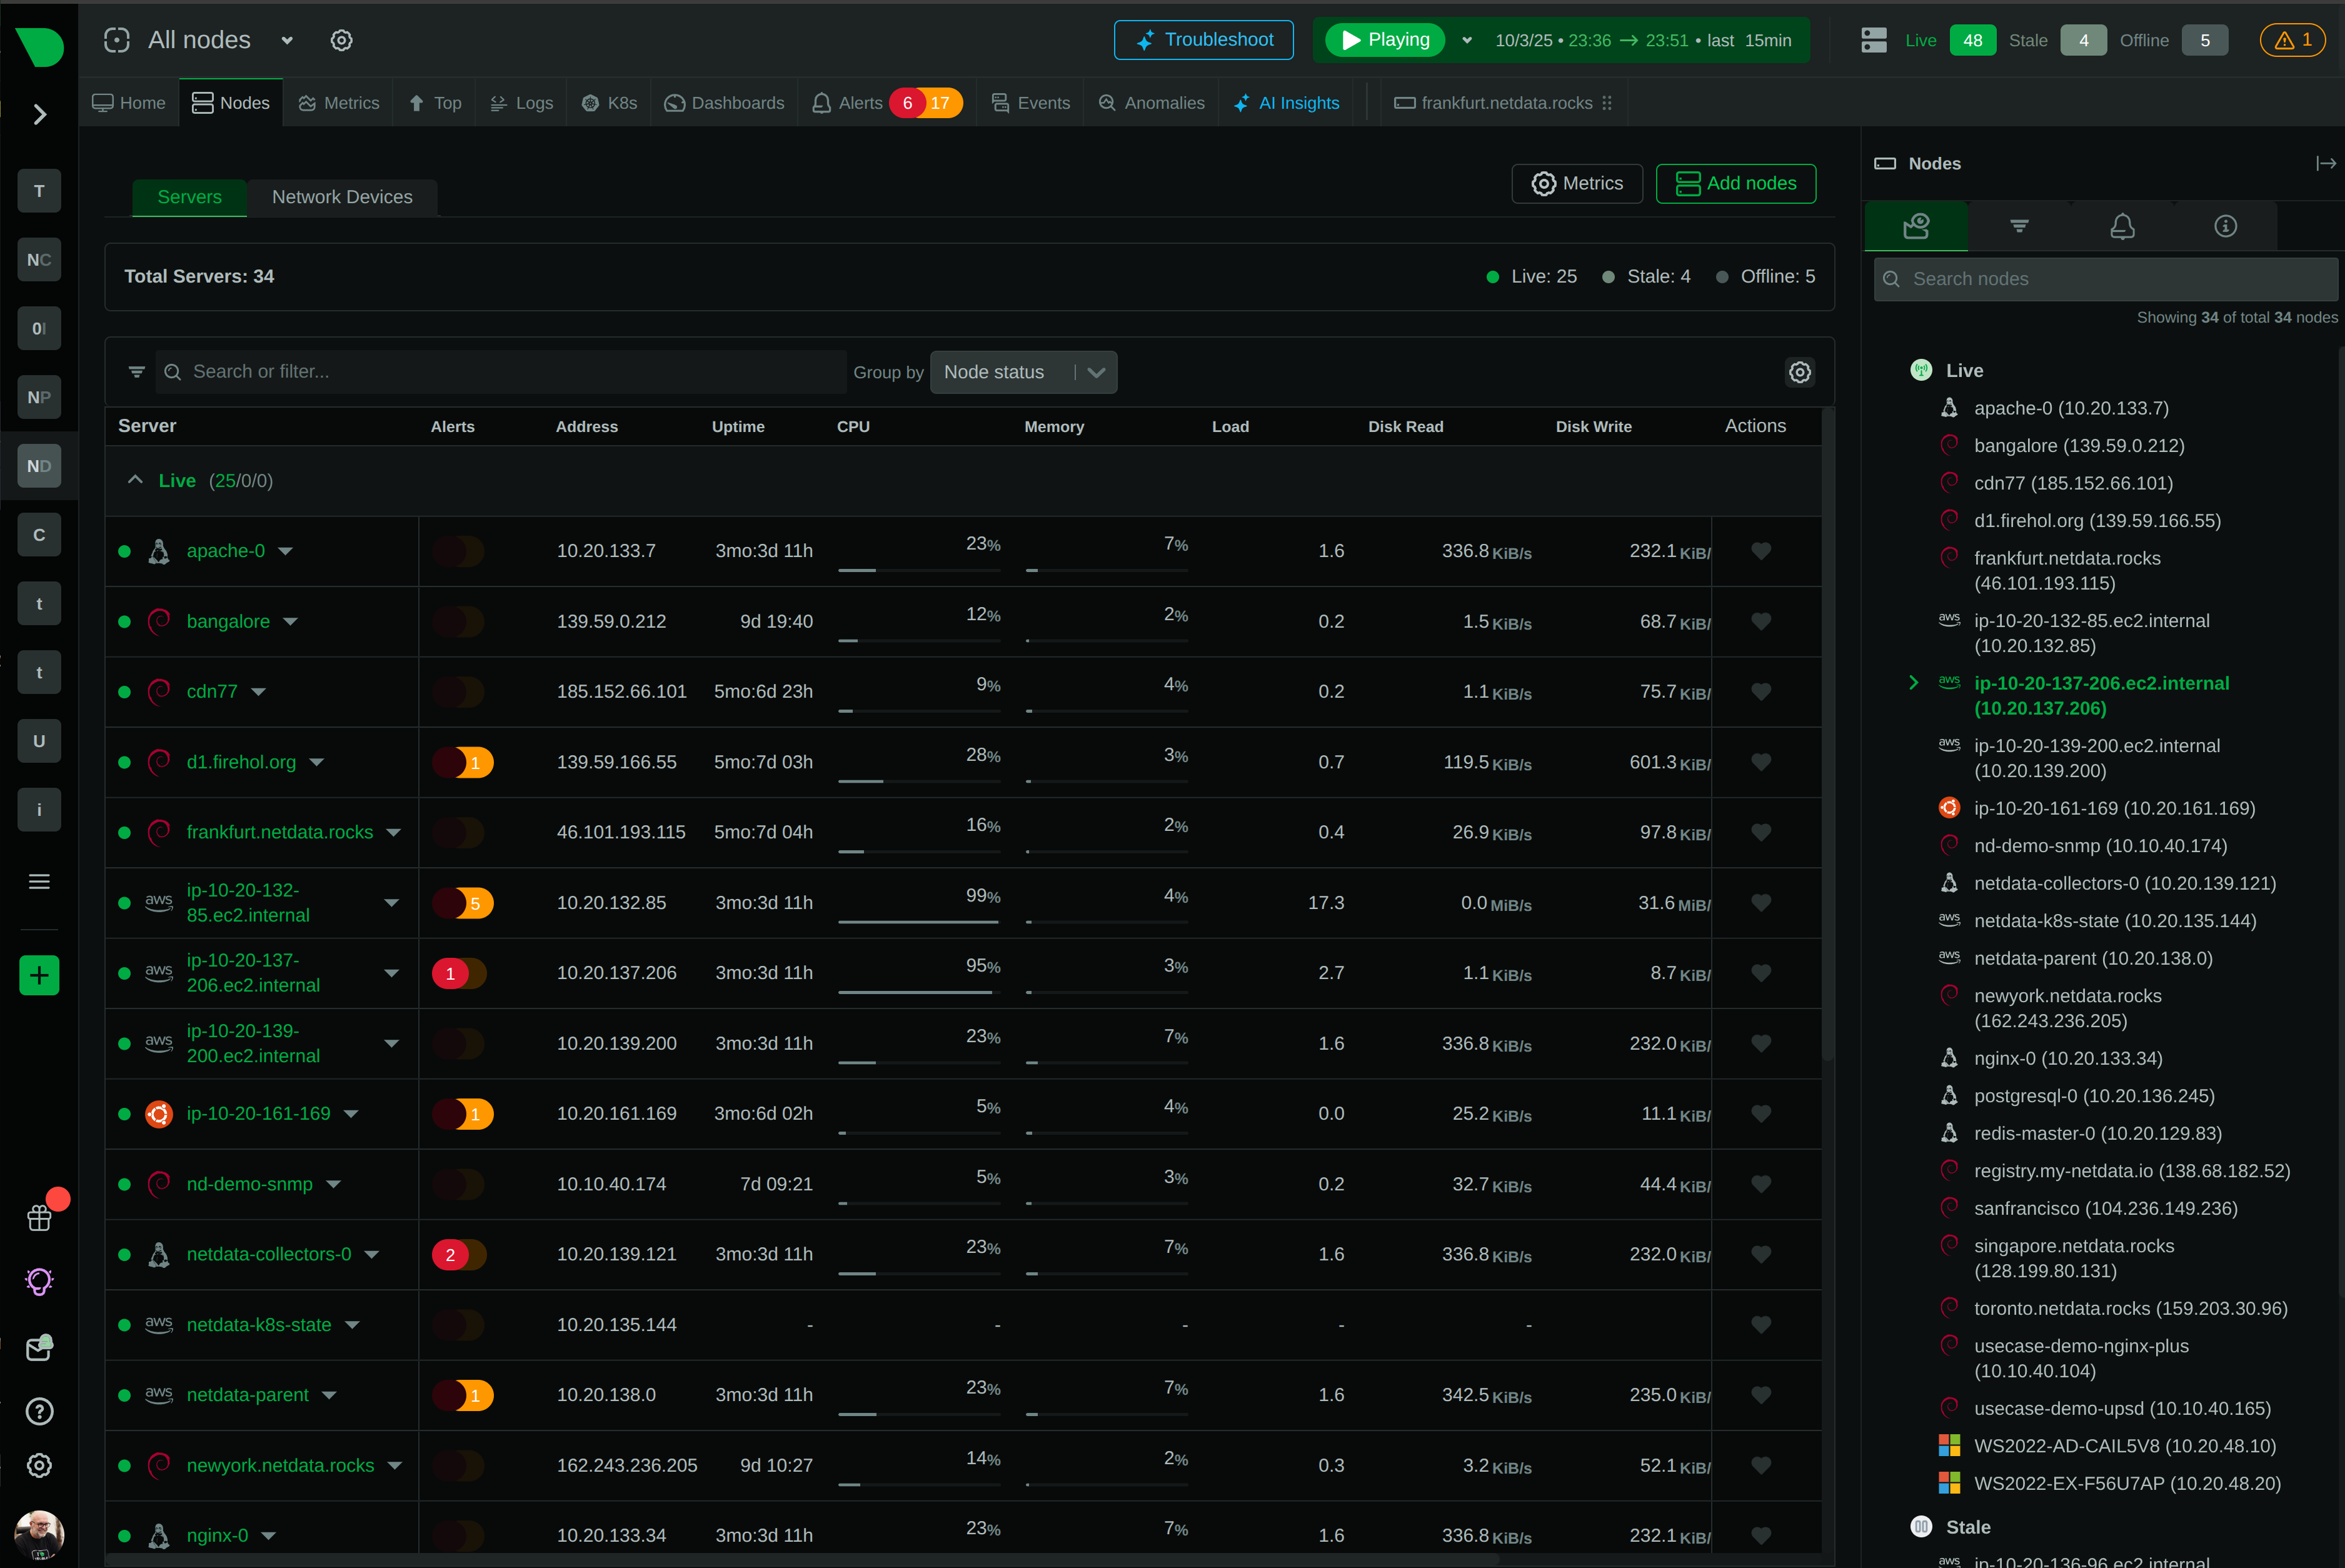
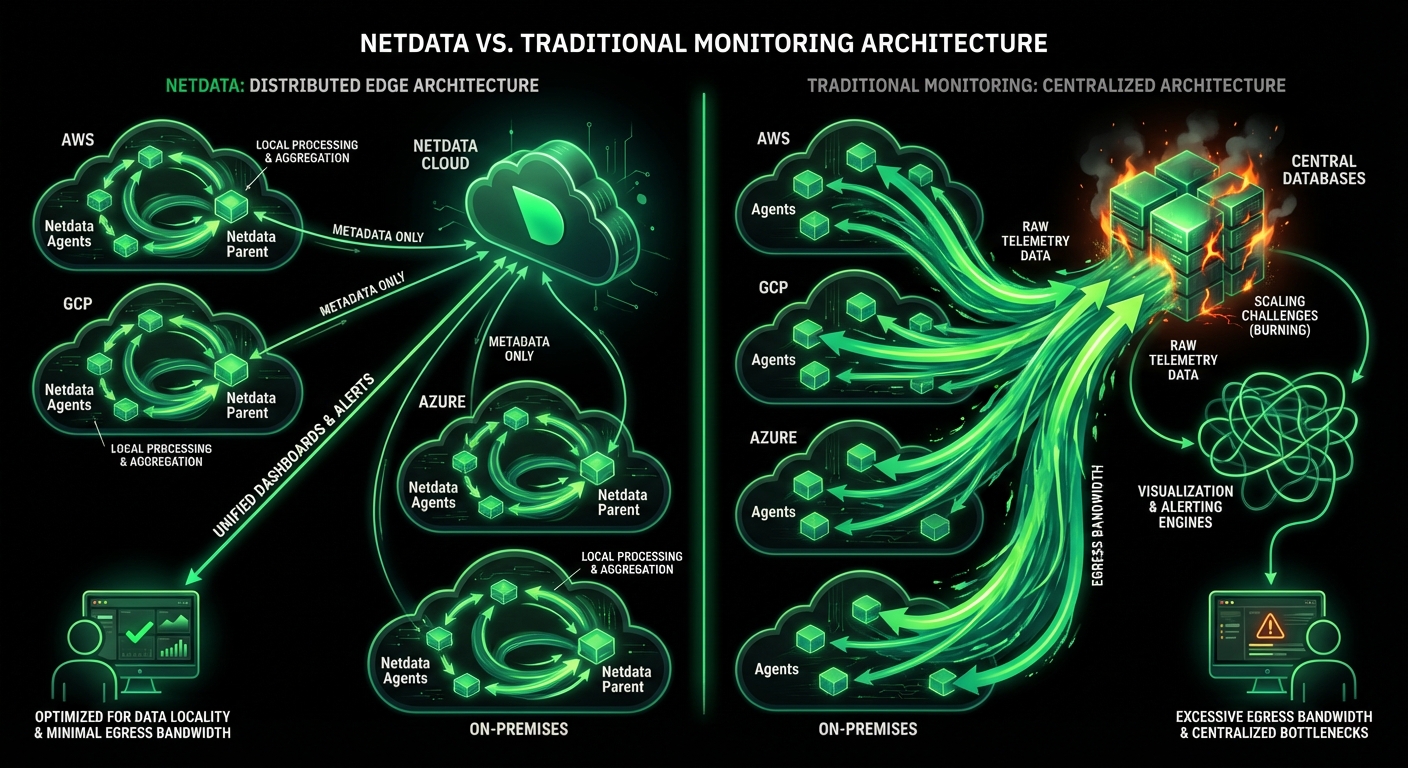
Netdata delivers per-second infrastructure visibility with predictable costs and zero configuration - catching transient issues that Azure Monitor’s 1-minute granularity makes invisible. Monitor AWS, Azure, GCP, and on-premises with a single agent while achieving 90% cost savings.

Background Hero

Why Infrastructure Teams Choose Netdata Over Azure Monitor

Real-time visibility, predictable costs, zero complexity

True Real-Time Monitoring

Per-second data collection with sub-2-second latency catches transient issues Azure Monitor’s 1-minute intervals miss entirely - see problems as they happen, not after they cascade.

Predictable Per-Node Pricing

Fixed per-node pricing eliminates surprise bills - monitor your entire infrastructure with unlimited metrics, logs, and users included while achieving 90% cost savings.

Zero Configuration Setup

From installation to production insights in 60 seconds - no KQL to learn, no dashboards to build, no Data Collection Rules to configure. Junior engineers operate at expert level immediately.

Native Multi-Cloud Support

Single agent works identically on AWS, Azure, GCP, and on-premises - unified visibility without Azure Arc dependencies or vendor lock-in across your entire infrastructure.

Complete Data Sovereignty

All observability data stays on-premises with edge-native processing - meet GDPR, HIPAA, and data residency requirements automatically while Azure Monitor centralizes to cloud.

ML-Powered Intelligence

18 machine learning models per metric with consensus-based detection identify anomalies at the edge - no cloud latency, no data egress, works offline in air-gapped environments.

Trusted by DevOps teams worldwide

Platform Comparison

Netdata vs Azure Monitor: Core Capabilities

See how Netdata’s edge-native architecture delivers superior performance, simplicity, and economics for infrastructure monitoring

Capability

Netdata

Azure Monitor

Data Granularity

✅ Per-second (1s)
Catches 2-10 second transient issues

⚠️ Per-minute (60s+)
Misses 90% of brief anomalies

Total Latency

✅ Sub-2 seconds
Fixed worst-case guarantee

⚠️ 20 seconds to 3 minutes
Average; incidents up to 14 hours

Setup Time

✅ 60 seconds
One-line install to production

❌ Days to weeks
Complex DCR configuration required

Query Language

✅ None required
Point-and-click NIDL framework

❌ KQL mandatory
4-6 weeks minimum learning curve

Multi-Cloud Support

✅ Native everywhere
Same agent AWS, Azure, GCP, on-prem

⚠️ Azure Arc required
Vendor lock-in for non-Azure

Data Sovereignty

✅ On-premises processing
All data stays local, works offline

❌ Cloud-only
All telemetry centralized to Azure

Agent CPU Usage

✅ <5% single core
Validated most energy-efficient

⚠️ 10-30% single core
51% avg, 262% peak at 10K EPS

Agent Memory

✅ 150-200 MB typical
Predictable with ML enabled

⚠️ 100+ MB baseline
276 MB avg, peaks to 1 GB

Cost Model

✅ Fixed per-node
Predictable, all-inclusive pricing

❌ Consumption-based
Unpredictable per-GB ingestion charges

Cost Predictability

✅ 90% cost savings
Unlimited metrics, logs, users

❌ Surprise bills common
Customers report unexpected costs

ML Anomaly Detection

✅ Edge-based, automatic
18 models/metric, consensus detection

✅ Cloud-based, configurable
Dynamic thresholds available

Open Source

✅ Free tier available
GPLv3+ licensed, 76K GitHub stars

❌ Proprietary only
Cloud-only SaaS service

Transform Your Infrastructure Monitoring Experience

Catch Problems Before They Cascade

Azure Monitor’s 1-minute intervals miss transient issues lasting 2-10 seconds - the anomalies that trigger cascading failures. Netdata’s per-second granularity reveals microbursts, TCP retransmissions, memory allocation spikes, and CPU steal events invisible to minute-level monitoring. See problems as they happen, not after they’ve escalated.

60× finer resolution

See Real-Time Difference

Catch Problems Before They Cascade

Eliminate Budget Anxiety Forever

Azure Monitor’s consumption-based pricing leads to unpredictable bills that customers report as their ’topmost expensive cost’. Netdata’s fixed per-node pricing includes unlimited metrics, logs, users, and alerts - no consumption surprises, no commitment tier minimums, no separate charges. Monitor comprehensively while achieving 90% cost savings.

Predictable per-node pricing

Calculate Your Savings

Eliminate Budget Anxiety Forever

Deploy in Minutes, Not Weeks

Azure Monitor requires Data Collection Rules configuration, KQL learning (4-6 weeks minimum), manual dashboard building, and days of setup. Netdata installs with one command, auto-discovers 800+ services, generates algorithmic dashboards instantly, and requires zero query language. Junior engineers get expert-level insights from day one.

60 seconds to production

Try Zero-Config Setup

Deploy in Minutes, Not Weeks

Unify Multi-Cloud Visibility

Azure Monitor requires Azure Arc agents for AWS/GCP, creating vendor lock-in and architectural complexity. Netdata uses the same lightweight agent everywhere - AWS EC2, Azure VMs, GCP Compute, on-premises servers - providing single-pane-of-glass visibility without vendor dependencies. True hybrid cloud monitoring without compromise.

Single unified dashboard

See Multi-Cloud Demo

Unify Multi-Cloud Visibility

Feature Comparison

Monitoring Features Side by Side

Comprehensive feature comparison for infrastructure monitoring capabilities

Feature

Netdata

Azure Monitor

OS Monitoring

✅ Comprehensive
CPU, memory, storage, network per-second

✅ Good
Platform metrics per-minute

Hardware Monitoring

✅ Extensive
IPMI, sensors, GPUs, EDAC ECC, RAPL

⚠️ Basic
Limited hardware visibility

Process Monitoring

✅ Real-time per-second
CPU, memory, I/O per process

✅ Good
Performance counters available

Container Monitoring

✅ Native cgroups
Docker, Podman, LXC, containerd

✅ Container Insights
AKS-optimized monitoring

Kubernetes Monitoring

✅ Full-stack visibility
Nodes, pods, services per-second

✅ Container Insights
Comprehensive K8s monitoring

Database Monitoring

✅ 50+ databases
MySQL, PostgreSQL, MongoDB, Redis, etc.

✅ Azure databases
Deep Azure SQL, Cosmos DB integration

Network Monitoring

✅ Per-second connections
Bandwidth, latency, connections per process

✅ Network Insights
Azure network resource monitoring

SNMP Monitoring

✅ Auto-discovery
Network devices, profiling, MIB selection

✅ Supported
Basic SNMP data collection

Logs Management

✅ Zero pipeline
Direct systemd-journal/Windows Event Log

⚠️ Ingestion pipeline
Per-GB charges with processing delays

Custom Metrics

✅ Unlimited included
StatsD, OpenMetrics, OpenTelemetry

⚠️ Charged separately
Per-sample consumption pricing

Synthetic Checks

✅ Built-in
HTTP, TCP, DNS, ping monitoring

✅ Availability tests
Standard and multi-step web tests

Integration Count

✅ 800+ collectors
Plus OpenMetrics, OTel, Nagios plugins

✅ 200+ Azure-native
Deep Azure ecosystem integration

View All Integrations

Key Advantages of Netdata's Edge-Native Architecture

See Problems as They Happen

Azure Monitor's 1-minute intervals miss transient issues lasting 2-10 seconds - the anomalies that trigger cascading failures. Netdata's per-second granularity with sub-2-second latency catches microbursts, TCP retransmissions, and memory spikes invisible to minute-level monitoring.

60× finer resolution

Experience Real-Time
Real-Time Dashboard

Use Case Comparison

Netdata vs Azure Monitor Use Cases

Which solution fits your monitoring needs best?

Use Case

Netdata

Azure Monitor

Real-Time Infrastructure Monitoring

✅ Ideal
Per-second visibility, sub-2s latency

⚠️ Near real-time
1-minute intervals, 20s-3min latency

Live Troubleshooting

✅ Console replacement
Browser-based debugging with history

⚠️ Limited
Requires SSH for real-time debugging

Multi-Cloud Infrastructure

✅ Native everywhere
AWS, Azure, GCP, on-prem unified

⚠️ Azure Arc required
Vendor lock-in for non-Azure

Hybrid Cloud Monitoring

✅ Seamless
Same agent cloud and on-premises

⚠️ Complex
Arc agents, separate management

Capacity Planning

✅ ML-powered insights
Anomaly detection, trend analysis

✅ Advanced analytics
Predictive capabilities, KQL queries

Application Performance Monitoring

⚠️ Basic
Via OpenTelemetry integration

✅ Comprehensive
Application Insights, distributed tracing

Regulated Industries (GDPR, HIPAA)

✅ Compliant by design
Data sovereignty, on-premises processing

⚠️ Cloud-only
Data centralized to Azure

Air-Gapped Environments

✅ Works offline
Full functionality without internet

❌ Requires connectivity
Cloud-dependent architecture

Edge/IoT Deployments

✅ Minimal footprint
<100 MB RAM, works offline

⚠️ Higher overhead
100+ MB RAM, cloud-dependent

Cost-Conscious Organizations

✅ Predictable per-node pricing
Fixed per-node, all-inclusive

❌ Unpredictable costs
Consumption-based, surprise bills

Small DevOps Teams

✅ Zero learning curve
No query language, instant insights

❌ Steep learning curve
KQL required, 4-6 weeks minimum

Azure PaaS Applications

⚠️ API-based
Can collect Azure metrics via API

✅ Native integration
Deep App Services, SQL, Cosmos DB

Frequently Asked Questions