


Alert fatigue usually isn’t caused by one thing. It’s the accumulation of thresholds that are slightly too sensitive, alerts that fire during known maintenance windows, and historical patterns that nobody has the tools to review easily. Fixing it requires better visibility into how alerts actually behave over time, and a way to test changes before they hit production.
We’ve shipped three improvements to alerting in Netdata that address different parts of this problem: the ability to evaluate alert definitions against historical data before deploying them, a timeline view of alert transitions, and a schedule preview for recurring silencing rules.
Evaluate alerts against historical data
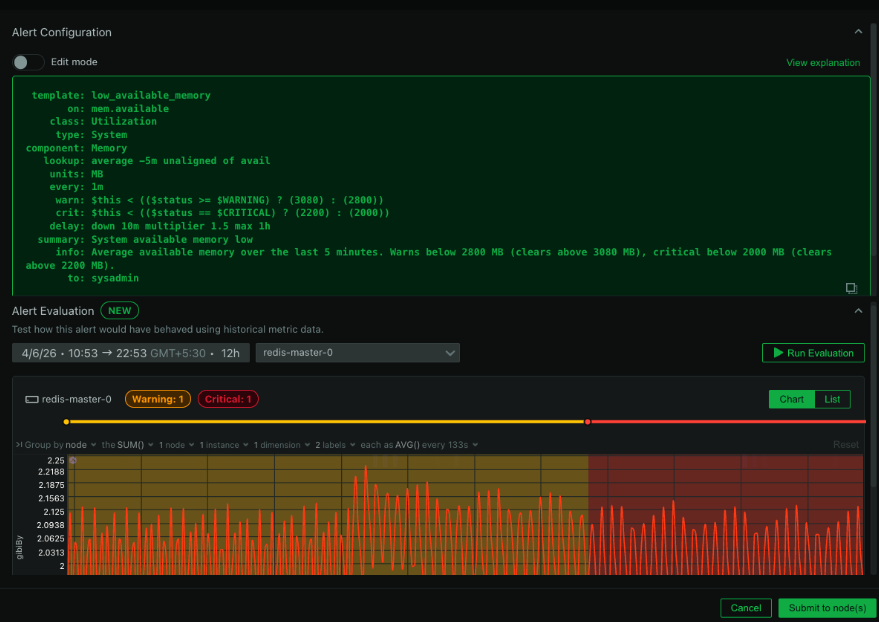
This is the one we’re most excited about. You can now test any alert configuration against real metric data from the past before you deploy it. Pick a node, choose a time window (up to 7 days), provide your alert definition, and Netdata replays your actual metrics through the alert’s expressions. It returns every status transition that would have occurred: every Clear, Warning, and Critical state change, laid out on a timeline.

The practical impact is significant. Instead of deploying a new alert and waiting days to see whether the thresholds are right, you can validate it immediately against data you already have. If the alert would have fired 47 times last Tuesday during a period you know was normal, you know the threshold is too aggressive before it ever reaches production. If it would have missed a real incident from last week, you know the threshold is too loose.
This also makes it much easier to debug alerts that are already causing fatigue. Take the definition that’s been waking people up at 3am, run it against the past week of data, and you can see exactly when and why it triggered. Tuning becomes a data-driven exercise instead of guesswork.
No notifications are sent during evaluation. No live alerting is affected. It’s a completely safe sandbox for alert development.
Alert transition timeline
For any active alert, you can now see a timeline view of its state transitions over a selectable historical period. This shows you when the alert entered Warning, when it escalated to Critical, when it cleared, and how frequently it’s been cycling.
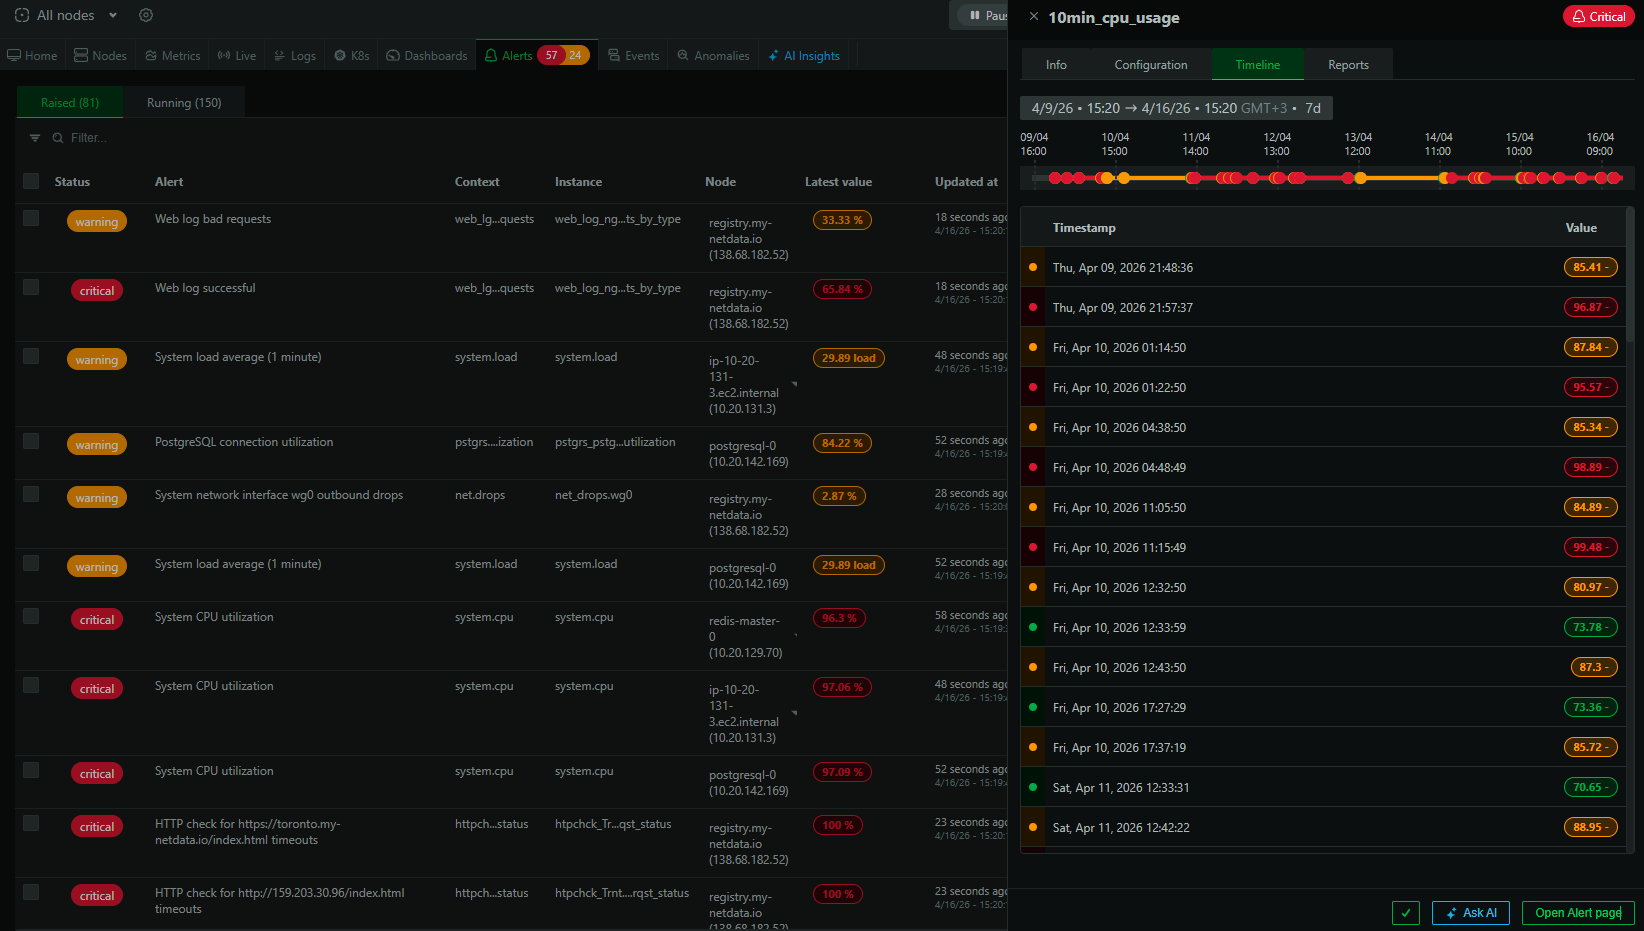
This sounds simple, but it answers questions that were previously hard to get at: Is this alert flapping? How long does it typically stay in Warning before escalating? Did it fire at the same time yesterday? Having this history visible directly on the alert page means you can assess an alert’s behavior patterns quickly, which is essential context when deciding whether to adjust its configuration.
Preview recurring silencing schedules
Netdata already supports silencing rules for maintenance windows. What’s new is the ability to preview recurring schedules before saving them. When you set up a recurrence pattern like “every weeknight from 10 PM to 6 AM” or “every Sunday from 2 AM to 6 AM,” Netdata now shows you a list of upcoming occurrences so you can verify the schedule is correct.
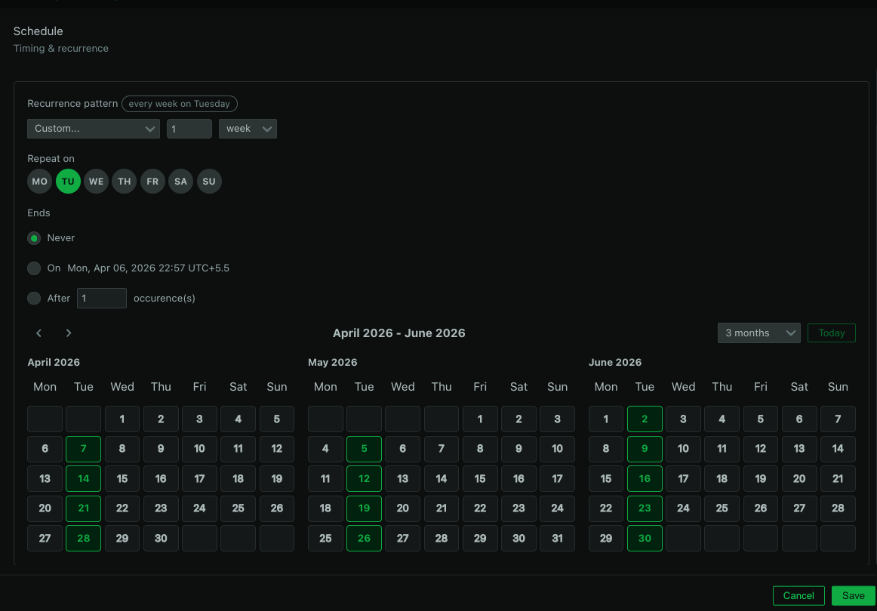
This catches the kind of mistakes that are easy to make and annoying to discover after the fact: off-by-one errors in day selection, timezone confusion (especially for teams distributed across regions), or recurrence patterns that don’t quite land where you intended. Verifying before saving beats finding out at 2am that your maintenance window silencing didn’t actually cover the right hours.
Taken together
Each of these features addresses a different stage of the alerting lifecycle. Evaluation helps you get the definition right before deployment. The transition timeline helps you understand how alerts behave in production. Silencing preview helps you manage maintenance windows accurately. None of them are flashy on their own, but together they give teams significantly more control over alert quality, which is the most direct lever you have against alert fatigue.
These features are available now for all users on a Business plan or free trial.