The only agent that thinks for itself

Autonomous Monitoring with self-learning AI built-in, operating independently across your entire stack.

Unlimited Metrics & Logs
Machine learning & MCP
5% CPU, 150MB RAM
3GB disk, >1 year retention
800+ integrations, zero config
Dashboards, alerts out of the box
> Discover Netdata Agents
Centralized metrics streaming and storage

Aggregate metrics from multiple agents into centralized Parent nodes for unified monitoring across your infrastructure.

Stream from unlimited agents
Long-term data retention
High availability clustering
Data replication & backup
Scalable architecture
Enterprise-grade security
> Learn about Parents
Fully managed cloud platform

Access your monitoring data from anywhere with our SaaS platform. No infrastructure to manage, automatic updates, and global availability.

Zero infrastructure management
99.9% uptime SLA
Global data centers
Automatic updates & patches
Enterprise SSO & RBAC
SOC2 & ISO certified
> Explore Netdata Cloud
Deploy Netdata Cloud in your infrastructure

Run the full Netdata Cloud platform on-premises for complete data sovereignty and compliance with your security policies.

Complete data sovereignty
Air-gapped deployment
Custom compliance controls
Private network integration
Dedicated support team
Kubernetes & Docker support
> Learn about Cloud On-Premises
Powerful, intuitive monitoring interface

Modern, responsive UI built for real-time troubleshooting with customizable dashboards and advanced visualization capabilities.

Real-time chart updates
Customizable dashboards
Dark & light themes
Advanced filtering & search
Responsive on all devices
Collaboration features
> Explore Netdata UI
Monitor on the go

Native iOS and Android apps bring full monitoring capabilities to your mobile device with real-time alerts and notifications.

iOS & Android apps
Push notifications
Touch-optimized interface
Offline data access
Biometric authentication
Widget support
> Download apps

Best energy efficiency

True real-time per-second

100% automated zero config

Centralized observability

Multi-year retention

High availability built-in

Zero maintenance

Always up-to-date

Enterprise security

Complete data control

Air-gap ready

Compliance certified

Millisecond responsiveness

Infinite zoom & pan

Works on any device

Native performance

Instant alerts

Monitor anywhere

80% Faster Incident Resolution
AI-powered troubleshooting from detection, to root cause and blast radius identification, to reporting.
True Real-Time and Simple, even at Scale
Linearly and infinitely scalable full-stack observability, that can be deployed even mid-crisis.
90% Cost Reduction, Full Fidelity
Instead of centralizing the data, Netdata distributes the code, eliminating pipelines and complexity.
Control Without Surrender
SOC 2 Type 2 certified with every metric kept on your infrastructure.
Integrations

800+ collectors and notification channels, auto-discovered and ready out of the box.

800+ data collectors
Auto-discovery & zero config
Cloud, infra, app protocols
Notifications out of the box
> Explore integrations
Real Results
46% Cost Reduction

Reduced monitoring costs by 46% while cutting staff overhead by 67%.

— Leonardo Antunez, Codyas

Zero Pipeline

No data shipping. No central storage costs. Query at the edge.

From Our Users
"Out-of-the-Box"

So many out-of-the-box features! I mostly don't have to develop anything.

— Simon Beginn, LANCOM Systems

No Query Language

Point-and-click troubleshooting. No PromQL, no LogQL, no learning curve.

Enterprise Ready
67% Less Staff, 46% Cost Cut

Enterprise efficiency without enterprise complexity—real ROI from day one.

— Leonardo Antunez, Codyas

SOC 2 Type 2 Certified

Zero data egress. Only metadata reaches the cloud. Your metrics stay on your infrastructure.

Full Coverage
800+ Collectors

Auto-discovered and configured. No manual setup required.

Any Notification Channel

Slack, PagerDuty, Teams, email, webhooks—all built-in.

From Our Users
"A Rare Unicorn"

Netdata gives more than you invest in it. A rare unicorn that obeys the Pareto rule.

— Eduard Porquet Mateu, TMB Barcelona

99% Downtime Reduction

Reduced website downtime by 99% and cloud bill by 30% using Netdata alerts.

— Falkland Islands Government

Real Savings
30% Cloud Cost Reduction

Optimized resource allocation based on Netdata alerts cut cloud spending by 30%.

— Falkland Islands Government

46% Cost Cut

Reduced monitoring staff by 67% while cutting operational costs by 46%.

— Codyas

Real Coverage
"Plugin for Everything"

Netdata has agent capacity or a plugin for everything, including Windows and Kubernetes.

— Eduard Porquet Mateu, TMB Barcelona

"Out-of-the-Box"

So many out-of-the-box features! I mostly don't have to develop anything.

— Simon Beginn, LANCOM Systems

Real Speed
Troubleshooting in 30 Seconds

From 2-3 minutes to 30 seconds—instant visibility into any node issue.

— Matthew Artist, Nodecraft

20% Downtime Reduction

20% less downtime and 40% budget optimization from out-of-the-box monitoring.

— Simon Beginn, LANCOM Systems

Pay per Node. Unlimited Everything Else.

One price per node. Unlimited metrics, logs, users, and retention. No per-GB surprises.

Free tier—forever
No metric limits or caps
Retention you control
Cancel anytime
> See pricing plans
What's Your Monitoring Really Costing You?

Most teams overpay by 40-60%. Let's find out why.

Expose hidden metric charges
Calculate tool consolidation
Customers report 30-67% savings
Results in under 60 seconds
> See what you're really paying
Your Infrastructure Is Unique. Let's Talk.

Because monitoring 10 nodes is different from monitoring 10,000.

On-prem & air-gapped deployment
Volume pricing & agreements
Architecture review for your scale
Compliance & security support
> Start a conversation
Monitoring That Sells Itself

Deploy in minutes. Impress clients in hours. Earn recurring revenue for years.

30-second live demos close deals
Zero config = zero support burden
Competitive margins & deal protection
Response in 48 hours
> Apply to partner
Per-Second Metrics at Homelab Prices

Same engine, same dashboards, same ML. Just priced for tinkerers.

Community: Free forever · 5 nodes · non-commercial
Homelab: $90/yr · unlimited nodes · fair usage
> Start monitoring your lab—free
$1,000 Per Referral. Unlimited Referrals.

Your colleagues get 10% off. You get 10% commission. Everyone wins.

10% of subscriptions, up to $1,000 each
Track earnings inside Netdata Cloud
PayPal/Venmo payouts in 3-4 weeks
No caps, no complexity
> Get your referral link
Cost Proof
40% Budget Optimization

"Netdata's significant positive impact" — LANCOM Systems

Calculate Your Savings

Compare vs Datadog, Grafana, Dynatrace

Savings Proof
46% Cost Reduction

"Cut costs by 46%, staff by 67%" — Codyas

30% Cloud Bill Savings

"Reduced cloud bill by 30%" — Falkland Islands Gov

Enterprise Proof
"Better Than Combined Alternatives"

"Better observability with Netdata than combining other tools." — TMB Barcelona

Real Engineers, <24h Response

DPA, SLAs, on-prem, volume pricing

Why Partners Win
Demo Live Infrastructure

One command, 30 seconds, real data—no sandbox needed

Zero Tickets, High Margins

Auto-config + per-node pricing = predictable profit

Homelab Ready
"Absolutely Incredible"

"We tested every monitoring system under the sun." — Benjamin Gabler, CEO Rocket.Net

76k+ GitHub Stars

3rd most starred monitoring project

Worth Recommending
Product That Delivers

Customers report 40-67% cost cuts, 99% downtime reduction

Zero Risk to Your Rep

Free tier lets them try before they buy

Never Fight Fires Alone

Docs, community, and expert help—pick your path to resolution.

Learn.netdata.cloud docs
Discord, Forums, GitHub
Premium support available
> Get answers now
60 Seconds to First Dashboard

One command to install. Zero config. 850+ integrations documented.

Linux, Windows, K8s, Docker
Auto-discovers your stack
> Start monitoring now
See Netdata in Action

Watch real-time monitoring in action—demos, tutorials, and engineering deep dives.

Product demos and walkthroughs
Real infrastructure, not staged
> Start with the 3-minute tour
Level Up Your Monitoring
Real problems. Real solutions. 112+ guides from basic monitoring to AI observability.
76,000+ Engineers Strong
615+ contributors. 1.5M daily downloads. One mission: simplify observability.
Per-Second. 90% Cheaper. Data Stays Home.
Side-by-side comparisons: costs, real-time granularity, and data sovereignty for every major tool.

See why teams switch from Datadog, Prometheus, Grafana, and more.

> Browse all comparisons
Edge-Native Observability, Born Open Source
Per-second visibility, ML on every metric, and data that never leaves your infrastructure.
Founded in 2016
615+ contributors worldwide
Remote-first, engineering-driven
Open source first
> Read our story
Promises We Publish—and Prove
12 principles backed by open code, independent validation, and measurable outcomes.
Open source, peer-reviewed
Zero config, instant value
Data sovereignty by design
Aligned pricing, no surprises
> See all 12 principles
Edge-Native, AI-Ready, 100% Open
76k+ stars. Full ML, AI, and automation—GPLv3+, not premium add-ons.
76,000+ GitHub stars
GPLv3+ licensed forever
ML on every metric, included
Zero vendor lock-in
> Explore our open source
Build Real-Time Observability for the World
Remote-first team shipping per-second monitoring with ML on every metric.
Remote-first, fully distributed
Open source (76k+ stars)
Challenging technical problems
Your code on millions of systems
> See open roles
Talk to a Netdata Human in <24 Hours
Sales, partnerships, press, or professional services—real engineers, fast answers.
Discuss your observability needs
Pricing and volume discounts
Partnership opportunities
Media and press inquiries
> Book a conversation
Your Data. Your Rules.
On-prem data, cloud control plane, transparent terms.
Trust & Scale
76,000+ GitHub Stars

One of the most popular open-source monitoring projects

SOC 2 Type 2 Certified

Enterprise-grade security and compliance

Data Sovereignty

Your metrics stay on your infrastructure

Validated
University of Amsterdam

"Most energy-efficient monitoring solution" — ICSOC 2023, peer-reviewed

ADASTEC (Autonomous Driving)

"Doesn't miss alerts—mission-critical trust for safety software"

Community Stats
615+ Contributors

Global community improving monitoring for everyone

1.5M+ Downloads/Day

Trusted by teams worldwide

GPLv3+ Licensed

Free forever, fully open source agent

Why Join?
Remote-First

Work from anywhere, async-friendly culture

Impact at Scale

Your work helps millions of systems

Compliance
SOC 2 Type 2

Audited security controls

GDPR Ready

Data stays on your infrastructure

About Netdata

Built by Engineers Who Needed Better Monitoring

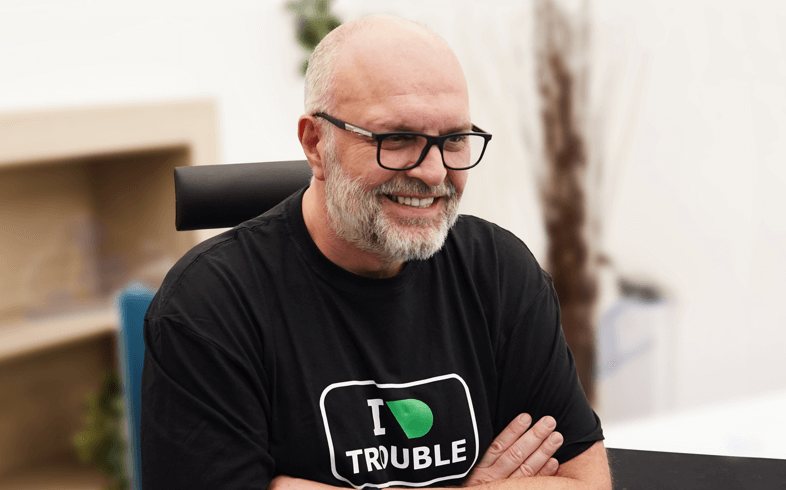
We’re a global team of 30 people committed to eliminating complexity in observability. Founded by Costa Tsaousis on the principle that monitoring should work for operators - not the other way around - we invest engineering effort to simplify operations, not to manage data pipelines.

Background Hero

What Drives Us

Our mission is to reveal and surface the pulse and breath of systems and applications, making infrastructure health visible and actionable without requiring deep expertise.

Real-Time Transparency

Per-second visibility into infrastructure health - see problems as they happen, not after they cascade.

Instant Value

From installation to complete observability in 60 seconds - zero configuration, automatic dashboards, ML-powered insights.

Data Sovereignty

Your infrastructure, your data, your control - all observability data stays on-premises under your management.

Transparent Economics

Predictable per-node pricing with unlimited metrics, logs, and users - 90% cost reduction versus traditional platforms.

Open by Design

Open-source foundation with 76,000+ GitHub stars - built by the community that uses it.

AI Throughout

Machine learning and AI embedded from data collection through troubleshooting - democratizing expertise for every engineer.

Trusted by DevOps teams worldwide

Our Story

The Problem We Saw

Traditional monitoring was too expensive, too complex, too slow. Organizations were forced to choose between collecting everything (expensive) or sampling data (blind spots). Engineers spent more time managing monitoring than solving problems.

Observability complexity was unsustainable

See How We're Different

The Problem We Saw

The Solution We Built

Instead of centralizing data, we distribute the code. Every Netdata Agent is a complete observability engine - collecting, storing, analyzing, and detecting anomalies locally. This edge-native architecture delivers real-time insights without centralized bottlenecks or exponential costs.

4.5+ billion metrics/second processed globally

Explore Our Architecture

The Solution We Built

The Impact We Deliver

Organizations using Netdata achieve 80% MTTR reduction, 90% cost reduction, and complete infrastructure transparency - from single nodes to 100,000+ systems. We’ve proven that monitoring can be simple, powerful, and affordable simultaneously.

80% MTTR reduction

Read Customer Stories

The Impact We Deliver

Our Core Values

Built for Daily Use

We build for engineers who use our tools daily - not for buyers or analysts. Every feature must make operations easier, faster, and more reliable.

Operations teams come first

See How It Works
Practitioner-First Dashboard

By The Numbers

Global Scale, Proven Impact

Netdata processes billions of metrics per second across global infrastructure - from single-node deployments to 100,000+ system installations. Our distributed architecture delivers measurable outcomes for organizations worldwide.

Metric

Value

Impact

GitHub Stars
Community validation and trust

76,000+
Most loved observability platform

Open Source Leadership
Largest community in CNCF observability category

Daily Downloads
Global adoption rate

1.5 Million
Per day worldwide

Massive Adoption
Trusted by engineers globally for production monitoring

Metrics Processed
Real-world scale validation

4.5+ Billion
Per second globally

Proven at Scale
Architecture validated across massive infrastructures

Contributors
Global development community

615+
Worldwide contributors

Community Innovation
Diverse perspectives driving continuous improvement

Largest Deployment
Enterprise scale capability

100,000+ Nodes
Single installation

Infinite Scalability
Linear scaling without architectural changes

MTTR Reduction
Average customer outcome

80%
Faster resolution

Operational Excellence
From alert to resolution in minutes, not hours

Cost Reduction
Versus traditional platforms

90%
Lower TCO

Predictable Economics
Per-node pricing with unlimited metrics and logs

Deployment Speed
Time to full visibility

60 Seconds
Install to insights

Instant Value
Zero configuration, automatic dashboards, ML-powered

Integrations
Auto-discovered coverage

800+
Systems and applications

Complete Coverage
Monitor everything without manual configuration

See Customer Stories

Independent Validation

Our engineering excellence is validated by peer-reviewed research and real-world deployments at scale.

Leadership Team

Costa Tsaousis, Founder & CEO

Founded Netdata on the principle that monitoring should work for operators - not the other way around. Costa leads our mission to eliminate complexity in observability through engineering excellence and open-source innovation.

Founder & CEO

Connect on LinkedIn

Costa Tsaousis, Founder & CEO

Experienced Leadership

Our leadership team brings decades of experience in observability, enterprise software, and global operations: Satyadeep Ashwathnarayana (Chief Business Officer), Dimitris Protogirou (CFO), Ralph Meijer (VP of Technology), Shyam Sreevalsan (VP of Strategy), Constantine Nikitiades (VP of Customer Success), and Mario Jokic (VP of Sales).

Global expertise

Join Our Team

Experienced Leadership

Why We Exist

Traditional monitoring creates problems we’re solving through engineering innovation and architectural rethinking.

Centralized monitoring creates bottlenecks

Traditional platforms centralize all data, creating exponential scaling costs and performance degradation

Distributed edge architecture

We distribute the code instead of centralizing the data - linear scaling without bottlenecks

Sampling hides critical problems

Traditional 30-second monitoring misses 90% of incidents that last 2-10 seconds

True real-time visibility

Per-second data collection with sub-2-second total latency reveals problems as they happen

Configuration complexity delays value

Traditional tools require weeks of setup, manual dashboard building, and specialized skills

Zero configuration deployment

From installation to complete observability in 60 seconds - automatic discovery and ML-powered insights

Volume-based pricing creates anxiety

Organizations forced to choose between collecting everything (expensive) or sampling data (blind spots)

Predictable per-node pricing

Unlimited metrics, logs, and users - 90% cost reduction with transparent economics

Frequently Asked Questions